Lumbee vs Yakama Disability
COMPARE
Lumbee
Yakama
Disability
Disability Comparison
Lumbee
Yakama
15.5%
DISABILITY
0.0/ 100
METRIC RATING
341st/ 347
METRIC RANK
13.4%
DISABILITY
0.0/ 100
METRIC RATING
304th/ 347
METRIC RANK
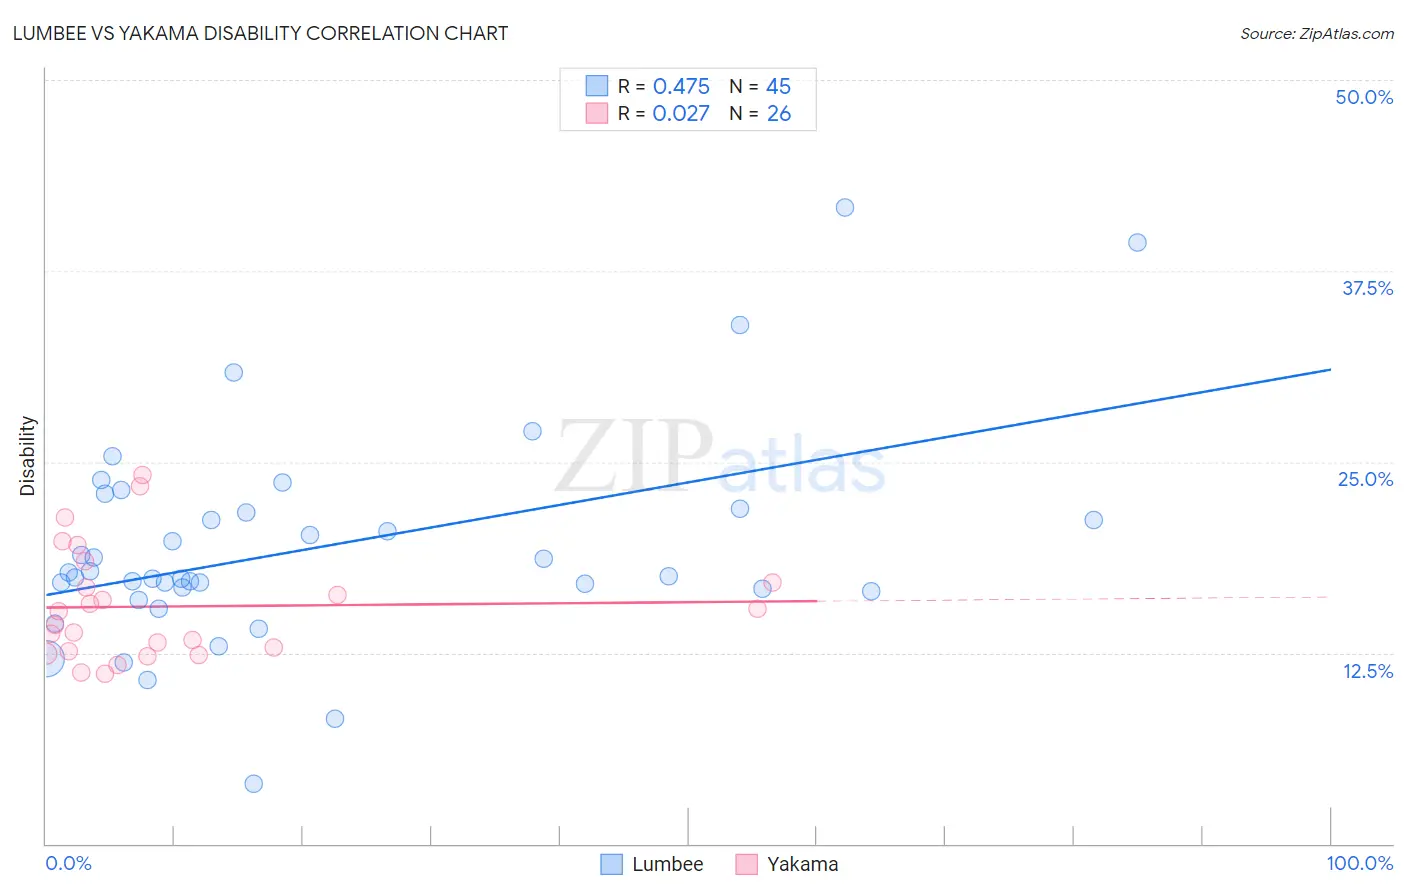
Lumbee vs Yakama Disability Correlation Chart
The statistical analysis conducted on geographies consisting of 92,289,178 people shows a moderate positive correlation between the proportion of Lumbee and percentage of population with a disability in the United States with a correlation coefficient (R) of 0.475 and weighted average of 15.5%. Similarly, the statistical analysis conducted on geographies consisting of 19,917,759 people shows no correlation between the proportion of Yakama and percentage of population with a disability in the United States with a correlation coefficient (R) of 0.027 and weighted average of 13.4%, a difference of 16.0%.
Disability Correlation Summary
| Measurement | Lumbee | Yakama |
| Minimum | 3.9% | 11.1% |
| Maximum | 41.7% | 24.1% |
| Range | 37.8% | 13.0% |
| Mean | 19.4% | 15.5% |
| Median | 17.5% | 14.7% |
| Interquartile 25% (IQ1) | 16.6% | 12.6% |
| Interquartile 75% (IQ3) | 21.8% | 17.1% |
| Interquartile Range (IQR) | 5.2% | 4.5% |
| Standard Deviation (Sample) | 7.0% | 3.7% |
| Standard Deviation (Population) | 6.9% | 3.6% |
Similar Demographics by Disability
Demographics Similar to Lumbee by Disability
In terms of disability, the demographic groups most similar to Lumbee are Kiowa (15.6%, a difference of 0.45%), Creek (15.6%, a difference of 0.47%), Choctaw (15.4%, a difference of 0.84%), Colville (15.8%, a difference of 1.7%), and Chickasaw (15.2%, a difference of 2.3%).
| Demographics | Rating | Rank | Disability |
| Cajuns | 0.0 /100 | #333 | Tragic 14.6% |
| Yuman | 0.0 /100 | #334 | Tragic 14.6% |
| Tohono O'odham | 0.0 /100 | #335 | Tragic 14.8% |
| Cherokee | 0.0 /100 | #336 | Tragic 14.8% |
| Seminole | 0.0 /100 | #337 | Tragic 14.9% |
| Dutch West Indians | 0.0 /100 | #338 | Tragic 14.9% |
| Chickasaw | 0.0 /100 | #339 | Tragic 15.2% |
| Choctaw | 0.0 /100 | #340 | Tragic 15.4% |
| Lumbee | 0.0 /100 | #341 | Tragic 15.5% |
| Kiowa | 0.0 /100 | #342 | Tragic 15.6% |
| Creek | 0.0 /100 | #343 | Tragic 15.6% |
| Colville | 0.0 /100 | #344 | Tragic 15.8% |
| Puerto Ricans | 0.0 /100 | #345 | Tragic 16.1% |
| Tsimshian | 0.0 /100 | #346 | Tragic 16.1% |
| Houma | 0.0 /100 | #347 | Tragic 17.1% |
Demographics Similar to Yakama by Disability
In terms of disability, the demographic groups most similar to Yakama are French Canadian (13.4%, a difference of 0.35%), Scotch-Irish (13.3%, a difference of 0.47%), Cape Verdean (13.5%, a difference of 0.95%), Shoshone (13.5%, a difference of 1.0%), and French American Indian (13.5%, a difference of 1.1%).
| Demographics | Rating | Rank | Disability |
| Hopi | 0.0 /100 | #297 | Tragic 13.2% |
| Alaska Natives | 0.0 /100 | #298 | Tragic 13.2% |
| French | 0.0 /100 | #299 | Tragic 13.2% |
| Pennsylvania Germans | 0.0 /100 | #300 | Tragic 13.2% |
| Immigrants | Micronesia | 0.0 /100 | #301 | Tragic 13.2% |
| Arapaho | 0.0 /100 | #302 | Tragic 13.2% |
| Scotch-Irish | 0.0 /100 | #303 | Tragic 13.3% |
| Yakama | 0.0 /100 | #304 | Tragic 13.4% |
| French Canadians | 0.0 /100 | #305 | Tragic 13.4% |
| Cape Verdeans | 0.0 /100 | #306 | Tragic 13.5% |
| Shoshone | 0.0 /100 | #307 | Tragic 13.5% |
| French American Indians | 0.0 /100 | #308 | Tragic 13.5% |
| Tlingit-Haida | 0.0 /100 | #309 | Tragic 13.5% |
| Blackfeet | 0.0 /100 | #310 | Tragic 13.6% |
| Delaware | 0.0 /100 | #311 | Tragic 13.6% |