Cuban vs Yakama Disability
COMPARE
Cuban
Yakama
Disability
Disability Comparison
Cubans
Yakama
11.7%
DISABILITY
56.7/ 100
METRIC RATING
165th/ 347
METRIC RANK
13.4%
DISABILITY
0.0/ 100
METRIC RATING
304th/ 347
METRIC RANK
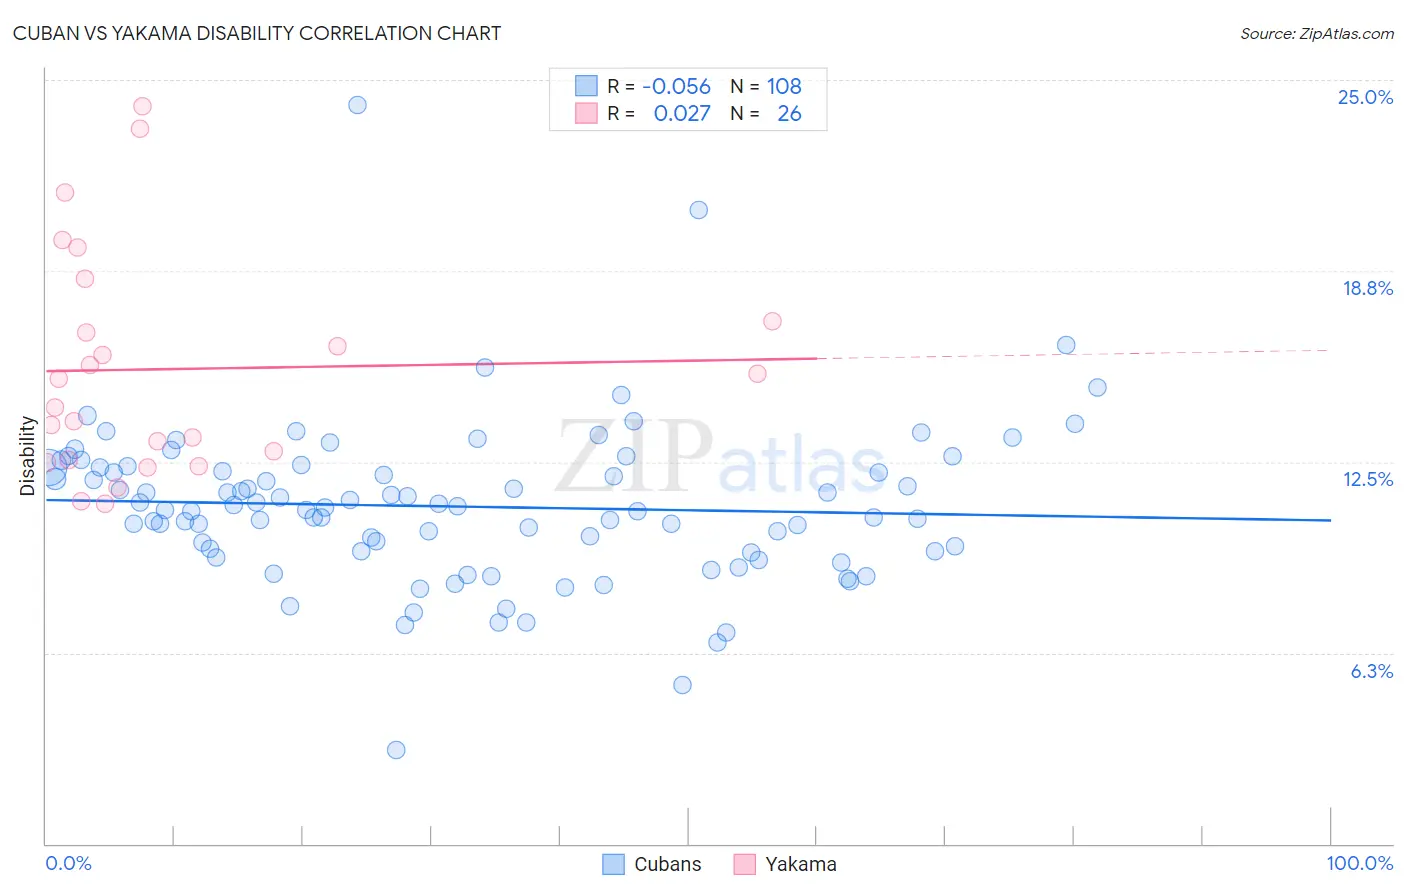
Cuban vs Yakama Disability Correlation Chart
The statistical analysis conducted on geographies consisting of 449,280,582 people shows a slight negative correlation between the proportion of Cubans and percentage of population with a disability in the United States with a correlation coefficient (R) of -0.056 and weighted average of 11.7%. Similarly, the statistical analysis conducted on geographies consisting of 19,917,759 people shows no correlation between the proportion of Yakama and percentage of population with a disability in the United States with a correlation coefficient (R) of 0.027 and weighted average of 13.4%, a difference of 14.7%.
Disability Correlation Summary
| Measurement | Cuban | Yakama |
| Minimum | 3.1% | 11.1% |
| Maximum | 24.2% | 24.1% |
| Range | 21.1% | 13.0% |
| Mean | 11.0% | 15.5% |
| Median | 11.0% | 14.7% |
| Interquartile 25% (IQ1) | 9.6% | 12.6% |
| Interquartile 75% (IQ3) | 12.3% | 17.1% |
| Interquartile Range (IQR) | 2.7% | 4.5% |
| Standard Deviation (Sample) | 2.7% | 3.7% |
| Standard Deviation (Population) | 2.6% | 3.6% |
Similar Demographics by Disability
Demographics Similar to Cubans by Disability
In terms of disability, the demographic groups most similar to Cubans are Syrian (11.7%, a difference of 0.080%), Pakistani (11.7%, a difference of 0.090%), Immigrants from Trinidad and Tobago (11.7%, a difference of 0.10%), Estonian (11.7%, a difference of 0.10%), and Immigrants from Haiti (11.7%, a difference of 0.12%).
| Demographics | Rating | Rank | Disability |
| Armenians | 65.9 /100 | #158 | Good 11.6% |
| Guatemalans | 65.1 /100 | #159 | Good 11.6% |
| Immigrants | Barbados | 64.2 /100 | #160 | Good 11.6% |
| Immigrants | Cuba | 62.8 /100 | #161 | Good 11.6% |
| Immigrants | Haiti | 59.2 /100 | #162 | Average 11.7% |
| Immigrants | Trinidad and Tobago | 58.9 /100 | #163 | Average 11.7% |
| Syrians | 58.5 /100 | #164 | Average 11.7% |
| Cubans | 56.7 /100 | #165 | Average 11.7% |
| Pakistanis | 54.7 /100 | #166 | Average 11.7% |
| Estonians | 54.4 /100 | #167 | Average 11.7% |
| Immigrants | Latin America | 54.1 /100 | #168 | Average 11.7% |
| Immigrants | Austria | 53.4 /100 | #169 | Average 11.7% |
| Immigrants | Albania | 52.8 /100 | #170 | Average 11.7% |
| Immigrants | Southern Europe | 52.8 /100 | #171 | Average 11.7% |
| Trinidadians and Tobagonians | 52.7 /100 | #172 | Average 11.7% |
Demographics Similar to Yakama by Disability
In terms of disability, the demographic groups most similar to Yakama are French Canadian (13.4%, a difference of 0.35%), Scotch-Irish (13.3%, a difference of 0.47%), Cape Verdean (13.5%, a difference of 0.95%), Shoshone (13.5%, a difference of 1.0%), and French American Indian (13.5%, a difference of 1.1%).
| Demographics | Rating | Rank | Disability |
| Hopi | 0.0 /100 | #297 | Tragic 13.2% |
| Alaska Natives | 0.0 /100 | #298 | Tragic 13.2% |
| French | 0.0 /100 | #299 | Tragic 13.2% |
| Pennsylvania Germans | 0.0 /100 | #300 | Tragic 13.2% |
| Immigrants | Micronesia | 0.0 /100 | #301 | Tragic 13.2% |
| Arapaho | 0.0 /100 | #302 | Tragic 13.2% |
| Scotch-Irish | 0.0 /100 | #303 | Tragic 13.3% |
| Yakama | 0.0 /100 | #304 | Tragic 13.4% |
| French Canadians | 0.0 /100 | #305 | Tragic 13.4% |
| Cape Verdeans | 0.0 /100 | #306 | Tragic 13.5% |
| Shoshone | 0.0 /100 | #307 | Tragic 13.5% |
| French American Indians | 0.0 /100 | #308 | Tragic 13.5% |
| Tlingit-Haida | 0.0 /100 | #309 | Tragic 13.5% |
| Blackfeet | 0.0 /100 | #310 | Tragic 13.6% |
| Delaware | 0.0 /100 | #311 | Tragic 13.6% |