Swedish vs Slovene Disability
COMPARE
Swedish
Slovene
Disability
Disability Comparison
Swedes
Slovenes
12.2%
DISABILITY
1.8/ 100
METRIC RATING
239th/ 347
METRIC RANK
12.4%
DISABILITY
0.6/ 100
METRIC RATING
255th/ 347
METRIC RANK
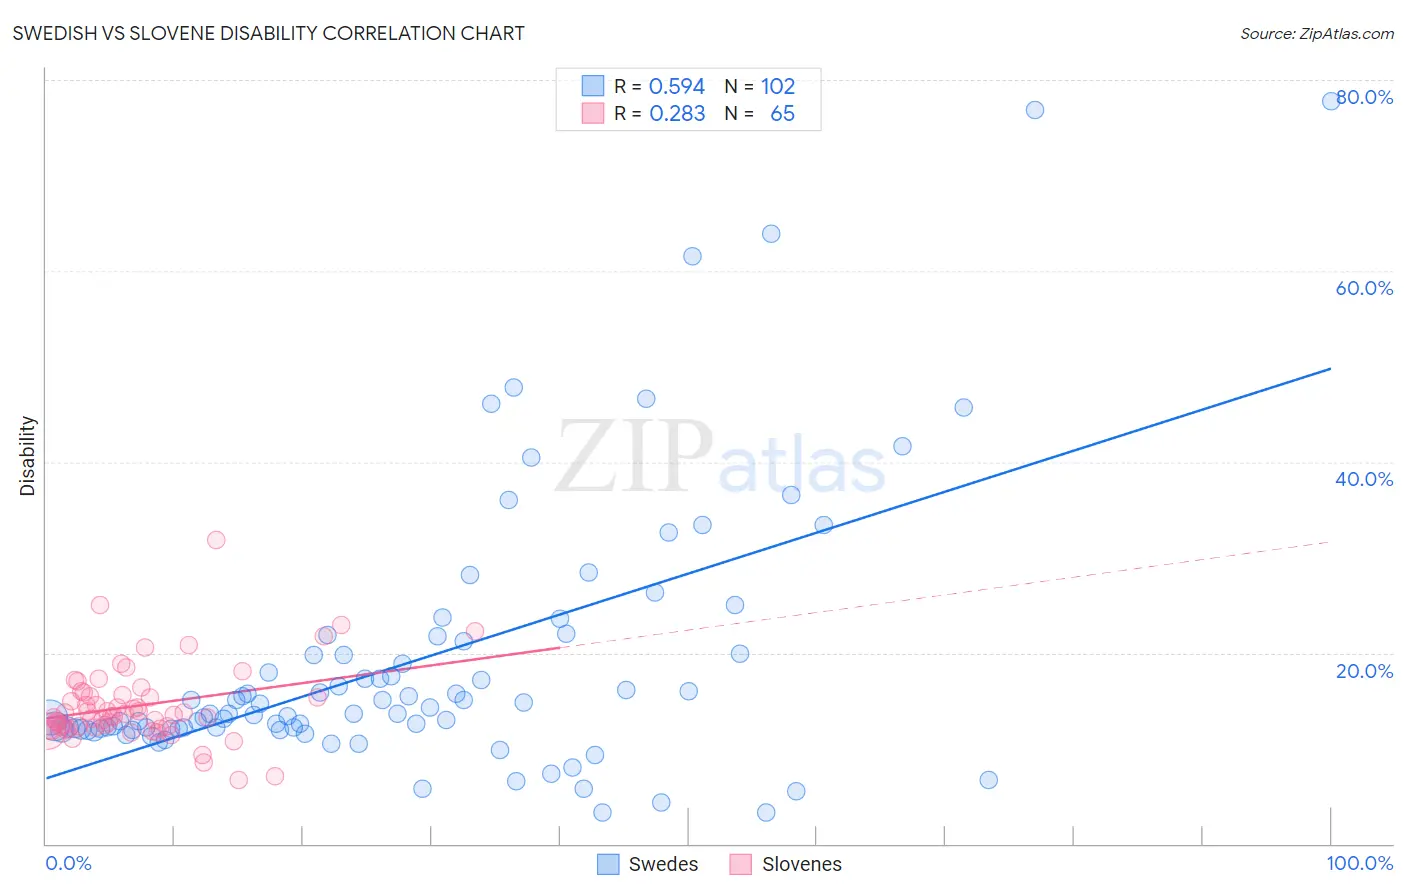
Swedish vs Slovene Disability Correlation Chart
The statistical analysis conducted on geographies consisting of 539,139,641 people shows a substantial positive correlation between the proportion of Swedes and percentage of population with a disability in the United States with a correlation coefficient (R) of 0.594 and weighted average of 12.2%. Similarly, the statistical analysis conducted on geographies consisting of 261,350,851 people shows a weak positive correlation between the proportion of Slovenes and percentage of population with a disability in the United States with a correlation coefficient (R) of 0.283 and weighted average of 12.4%, a difference of 1.1%.
Disability Correlation Summary
| Measurement | Swedish | Slovene |
| Minimum | 3.3% | 6.7% |
| Maximum | 77.8% | 31.8% |
| Range | 74.5% | 25.1% |
| Mean | 19.0% | 14.5% |
| Median | 13.6% | 13.5% |
| Interquartile 25% (IQ1) | 12.0% | 12.1% |
| Interquartile 75% (IQ3) | 19.9% | 15.7% |
| Interquartile Range (IQR) | 8.0% | 3.6% |
| Standard Deviation (Sample) | 14.2% | 4.1% |
| Standard Deviation (Population) | 14.1% | 4.1% |
Demographics Similar to Swedes and Slovenes by Disability
In terms of disability, the demographic groups most similar to Swedes are Norwegian (12.2%, a difference of 0.040%), Hungarian (12.2%, a difference of 0.050%), Yugoslavian (12.2%, a difference of 0.050%), Immigrants from Congo (12.2%, a difference of 0.080%), and Polish (12.2%, a difference of 0.080%). Similarly, the demographic groups most similar to Slovenes are Immigrants from Dominica (12.4%, a difference of 0.070%), Immigrants from Laos (12.4%, a difference of 0.16%), German Russian (12.3%, a difference of 0.33%), Belgian (12.3%, a difference of 0.35%), and Bermudan (12.3%, a difference of 0.66%).
| Demographics | Rating | Rank | Disability |
| Immigrants | Congo | 1.9 /100 | #237 | Tragic 12.2% |
| Norwegians | 1.9 /100 | #238 | Tragic 12.2% |
| Swedes | 1.8 /100 | #239 | Tragic 12.2% |
| Hungarians | 1.7 /100 | #240 | Tragic 12.2% |
| Yugoslavians | 1.7 /100 | #241 | Tragic 12.2% |
| Poles | 1.7 /100 | #242 | Tragic 12.2% |
| British | 1.5 /100 | #243 | Tragic 12.2% |
| Basques | 1.5 /100 | #244 | Tragic 12.2% |
| Liberians | 1.5 /100 | #245 | Tragic 12.2% |
| Swiss | 1.5 /100 | #246 | Tragic 12.2% |
| Indonesians | 1.4 /100 | #247 | Tragic 12.2% |
| Guamanians/Chamorros | 1.4 /100 | #248 | Tragic 12.3% |
| Carpatho Rusyns | 1.4 /100 | #249 | Tragic 12.3% |
| Sub-Saharan Africans | 1.4 /100 | #250 | Tragic 12.3% |
| Europeans | 1.4 /100 | #251 | Tragic 12.3% |
| Bermudans | 1.1 /100 | #252 | Tragic 12.3% |
| Belgians | 0.8 /100 | #253 | Tragic 12.3% |
| German Russians | 0.8 /100 | #254 | Tragic 12.3% |
| Slovenes | 0.6 /100 | #255 | Tragic 12.4% |
| Immigrants | Dominica | 0.6 /100 | #256 | Tragic 12.4% |
| Immigrants | Laos | 0.5 /100 | #257 | Tragic 12.4% |