Swedish vs Immigrants from China In Labor Force | Age 30-34
COMPARE
Swedish
Immigrants from China
In Labor Force | Age 30-34
In Labor Force | Age 30-34 Comparison
Swedes
Immigrants from China
85.2%
IN LABOR FORCE | AGE 30-34
97.5/ 100
METRIC RATING
94th/ 347
METRIC RANK
85.4%
IN LABOR FORCE | AGE 30-34
99.0/ 100
METRIC RATING
72nd/ 347
METRIC RANK
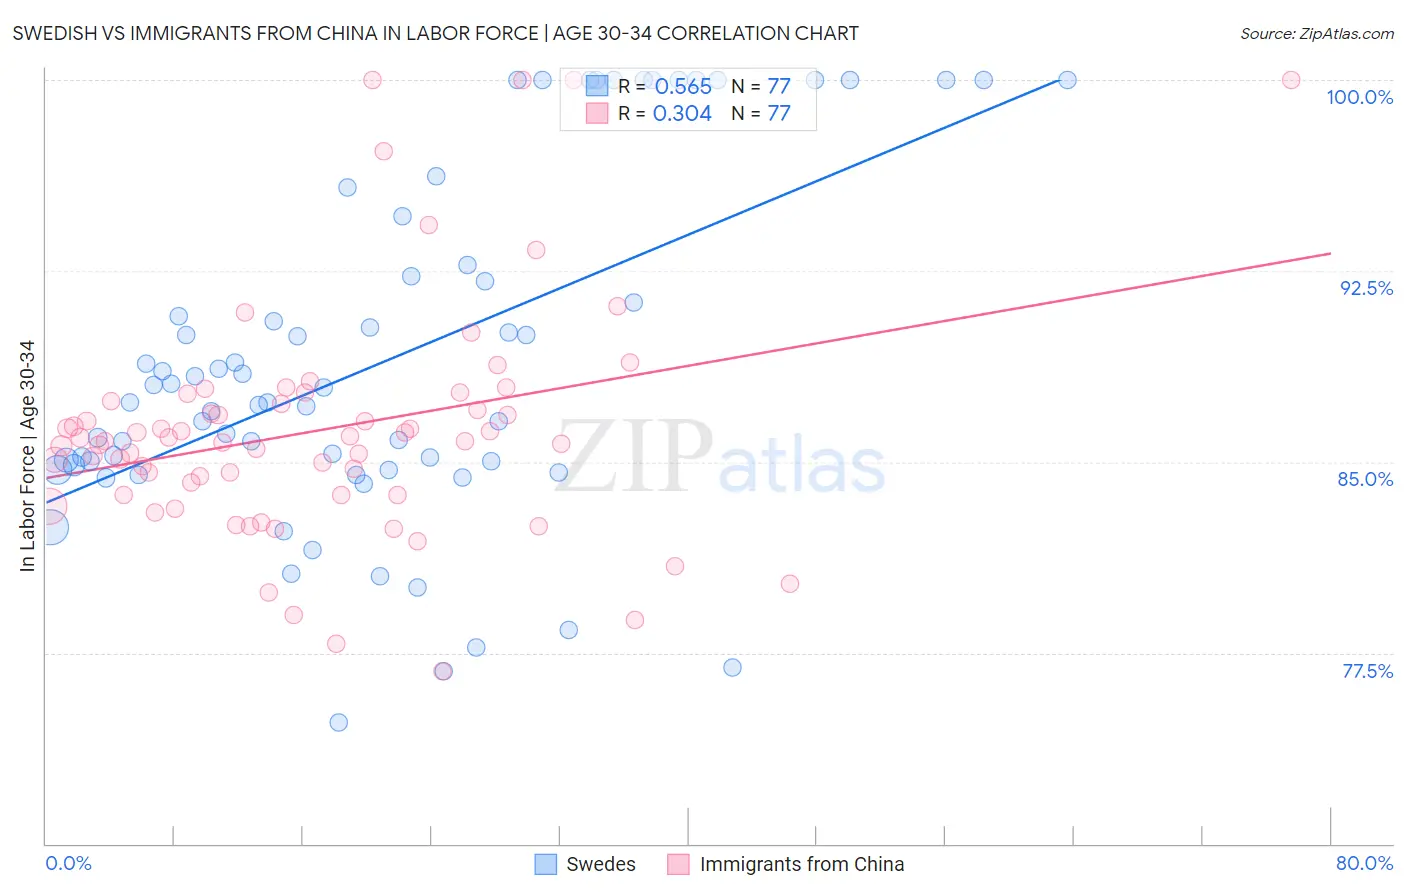
Swedish vs Immigrants from China In Labor Force | Age 30-34 Correlation Chart
The statistical analysis conducted on geographies consisting of 538,314,811 people shows a substantial positive correlation between the proportion of Swedes and labor force participation rate among population between the ages 30 and 34 in the United States with a correlation coefficient (R) of 0.565 and weighted average of 85.2%. Similarly, the statistical analysis conducted on geographies consisting of 456,657,709 people shows a mild positive correlation between the proportion of Immigrants from China and labor force participation rate among population between the ages 30 and 34 in the United States with a correlation coefficient (R) of 0.304 and weighted average of 85.4%, a difference of 0.17%.
In Labor Force | Age 30-34 Correlation Summary
| Measurement | Swedish | Immigrants from China |
| Minimum | 74.7% | 76.8% |
| Maximum | 100.0% | 100.0% |
| Range | 25.3% | 23.2% |
| Mean | 89.0% | 86.3% |
| Median | 87.3% | 85.8% |
| Interquartile 25% (IQ1) | 84.8% | 83.7% |
| Interquartile 75% (IQ3) | 92.5% | 87.5% |
| Interquartile Range (IQR) | 7.7% | 3.8% |
| Standard Deviation (Sample) | 6.8% | 4.6% |
| Standard Deviation (Population) | 6.7% | 4.6% |
Similar Demographics by In Labor Force | Age 30-34
Demographics Similar to Swedes by In Labor Force | Age 30-34
In terms of in labor force | age 30-34, the demographic groups most similar to Swedes are Immigrants from India (85.2%, a difference of 0.0%), Immigrants from Norway (85.2%, a difference of 0.010%), Immigrants from Korea (85.2%, a difference of 0.010%), German Russian (85.2%, a difference of 0.020%), and Thai (85.2%, a difference of 0.020%).
| Demographics | Rating | Rank | In Labor Force | Age 30-34 |
| Immigrants | Northern Europe | 98.2 /100 | #87 | Exceptional 85.3% |
| Immigrants | Belgium | 98.2 /100 | #88 | Exceptional 85.3% |
| Immigrants | Kazakhstan | 98.1 /100 | #89 | Exceptional 85.3% |
| Burmese | 97.9 /100 | #90 | Exceptional 85.3% |
| Immigrants | Moldova | 97.9 /100 | #91 | Exceptional 85.3% |
| German Russians | 97.7 /100 | #92 | Exceptional 85.2% |
| Immigrants | Norway | 97.6 /100 | #93 | Exceptional 85.2% |
| Swedes | 97.5 /100 | #94 | Exceptional 85.2% |
| Immigrants | India | 97.4 /100 | #95 | Exceptional 85.2% |
| Immigrants | Korea | 97.3 /100 | #96 | Exceptional 85.2% |
| Thais | 97.2 /100 | #97 | Exceptional 85.2% |
| Immigrants | Uganda | 97.2 /100 | #98 | Exceptional 85.2% |
| Belgians | 97.2 /100 | #99 | Exceptional 85.2% |
| Sudanese | 97.1 /100 | #100 | Exceptional 85.2% |
| Immigrants | Belarus | 96.9 /100 | #101 | Exceptional 85.2% |
Demographics Similar to Immigrants from China by In Labor Force | Age 30-34
In terms of in labor force | age 30-34, the demographic groups most similar to Immigrants from China are Immigrants from Japan (85.4%, a difference of 0.0%), Indian (Asian) (85.4%, a difference of 0.0%), Maltese (85.4%, a difference of 0.0%), Brazilian (85.4%, a difference of 0.010%), and Immigrants from Czechoslovakia (85.4%, a difference of 0.010%).
| Demographics | Rating | Rank | In Labor Force | Age 30-34 |
| Senegalese | 99.4 /100 | #65 | Exceptional 85.4% |
| Ghanaians | 99.4 /100 | #66 | Exceptional 85.4% |
| Kenyans | 99.3 /100 | #67 | Exceptional 85.4% |
| Immigrants | Eastern Europe | 99.3 /100 | #68 | Exceptional 85.4% |
| Immigrants | Iran | 99.2 /100 | #69 | Exceptional 85.4% |
| Brazilians | 99.1 /100 | #70 | Exceptional 85.4% |
| Immigrants | Japan | 99.1 /100 | #71 | Exceptional 85.4% |
| Immigrants | China | 99.0 /100 | #72 | Exceptional 85.4% |
| Indians (Asian) | 99.0 /100 | #73 | Exceptional 85.4% |
| Maltese | 99.0 /100 | #74 | Exceptional 85.4% |
| Immigrants | Czechoslovakia | 99.0 /100 | #75 | Exceptional 85.4% |
| Iranians | 99.0 /100 | #76 | Exceptional 85.4% |
| Immigrants | Eastern Asia | 98.9 /100 | #77 | Exceptional 85.4% |
| Immigrants | Singapore | 98.8 /100 | #78 | Exceptional 85.3% |
| Immigrants | Switzerland | 98.7 /100 | #79 | Exceptional 85.3% |