Swedish vs Immigrants from China 1 or more Vehicles in Household
COMPARE
Swedish
Immigrants from China
1 or more Vehicles in Household
1 or more Vehicles in Household Comparison
Swedes
Immigrants from China
93.3%
1 OR MORE VEHICLES IN HOUSEHOLD
100.0/ 100
METRIC RATING
8th/ 347
METRIC RANK
84.9%
1 OR MORE VEHICLES IN HOUSEHOLD
0.0/ 100
METRIC RATING
305th/ 347
METRIC RANK
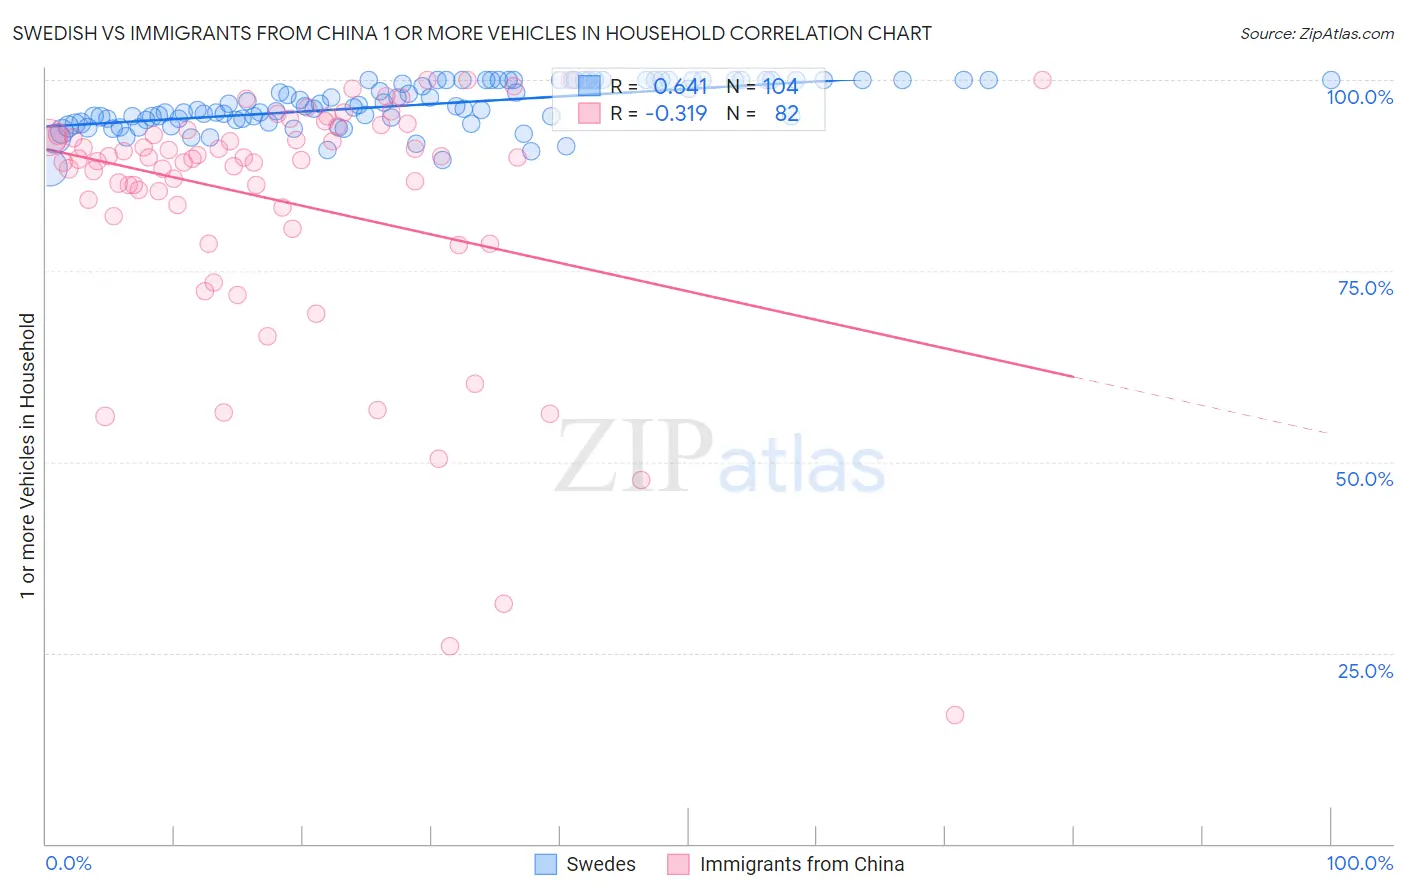
Swedish vs Immigrants from China 1 or more Vehicles in Household Correlation Chart
The statistical analysis conducted on geographies consisting of 538,855,851 people shows a significant positive correlation between the proportion of Swedes and percentage of households with 1 or more vehicles available in the United States with a correlation coefficient (R) of 0.641 and weighted average of 93.3%. Similarly, the statistical analysis conducted on geographies consisting of 456,603,328 people shows a mild negative correlation between the proportion of Immigrants from China and percentage of households with 1 or more vehicles available in the United States with a correlation coefficient (R) of -0.319 and weighted average of 84.9%, a difference of 9.9%.
1 or more Vehicles in Household Correlation Summary
| Measurement | Swedish | Immigrants from China |
| Minimum | 88.5% | 16.8% |
| Maximum | 100.0% | 100.0% |
| Range | 11.5% | 83.2% |
| Mean | 96.7% | 84.0% |
| Median | 96.5% | 89.7% |
| Interquartile 25% (IQ1) | 94.8% | 83.3% |
| Interquartile 75% (IQ3) | 100.0% | 92.9% |
| Interquartile Range (IQR) | 5.2% | 9.6% |
| Standard Deviation (Sample) | 2.9% | 16.7% |
| Standard Deviation (Population) | 2.9% | 16.6% |
Similar Demographics by 1 or more Vehicles in Household
Demographics Similar to Swedes by 1 or more Vehicles in Household
In terms of 1 or more vehicles in household, the demographic groups most similar to Swedes are Scotch-Irish (93.3%, a difference of 0.010%), Scottish (93.4%, a difference of 0.040%), Dutch (93.3%, a difference of 0.040%), Czech (93.3%, a difference of 0.070%), and Danish (93.5%, a difference of 0.23%).
| Demographics | Rating | Rank | 1 or more Vehicles in Household |
| Luxembourgers | 100.0 /100 | #1 | Exceptional 94.8% |
| English | 100.0 /100 | #2 | Exceptional 93.8% |
| Norwegians | 100.0 /100 | #3 | Exceptional 93.7% |
| Germans | 100.0 /100 | #4 | Exceptional 93.6% |
| Yakama | 100.0 /100 | #5 | Exceptional 93.6% |
| Danes | 100.0 /100 | #6 | Exceptional 93.5% |
| Scottish | 100.0 /100 | #7 | Exceptional 93.4% |
| Swedes | 100.0 /100 | #8 | Exceptional 93.3% |
| Scotch-Irish | 100.0 /100 | #9 | Exceptional 93.3% |
| Dutch | 100.0 /100 | #10 | Exceptional 93.3% |
| Czechs | 100.0 /100 | #11 | Exceptional 93.3% |
| Scandinavians | 100.0 /100 | #12 | Exceptional 93.1% |
| Whites/Caucasians | 100.0 /100 | #13 | Exceptional 93.1% |
| Irish | 100.0 /100 | #14 | Exceptional 93.1% |
| Mexicans | 100.0 /100 | #15 | Exceptional 93.0% |
Demographics Similar to Immigrants from China by 1 or more Vehicles in Household
In terms of 1 or more vehicles in household, the demographic groups most similar to Immigrants from China are Immigrants from Western Africa (84.9%, a difference of 0.020%), Tohono O'odham (84.7%, a difference of 0.28%), Immigrants from Belize (84.7%, a difference of 0.31%), Immigrants from Haiti (84.7%, a difference of 0.32%), and Immigrants from Ukraine (85.2%, a difference of 0.34%).
| Demographics | Rating | Rank | 1 or more Vehicles in Household |
| Belizeans | 0.0 /100 | #298 | Tragic 85.7% |
| Yuman | 0.0 /100 | #299 | Tragic 85.5% |
| Immigrants | Russia | 0.0 /100 | #300 | Tragic 85.4% |
| Immigrants | Panama | 0.0 /100 | #301 | Tragic 85.4% |
| Moroccans | 0.0 /100 | #302 | Tragic 85.4% |
| Immigrants | Greece | 0.0 /100 | #303 | Tragic 85.4% |
| Immigrants | Ukraine | 0.0 /100 | #304 | Tragic 85.2% |
| Immigrants | China | 0.0 /100 | #305 | Tragic 84.9% |
| Immigrants | Western Africa | 0.0 /100 | #306 | Tragic 84.9% |
| Tohono O'odham | 0.0 /100 | #307 | Tragic 84.7% |
| Immigrants | Belize | 0.0 /100 | #308 | Tragic 84.7% |
| Immigrants | Haiti | 0.0 /100 | #309 | Tragic 84.7% |
| U.S. Virgin Islanders | 0.0 /100 | #310 | Tragic 84.6% |
| Puerto Ricans | 0.0 /100 | #311 | Tragic 84.6% |
| Cape Verdeans | 0.0 /100 | #312 | Tragic 84.5% |