Swedish vs Delaware Male Disability
COMPARE
Swedish
Delaware
Male Disability
Male Disability Comparison
Swedes
Delaware
12.1%
MALE DISABILITY
0.3/ 100
METRIC RATING
260th/ 347
METRIC RANK
13.5%
MALE DISABILITY
0.0/ 100
METRIC RATING
311th/ 347
METRIC RANK
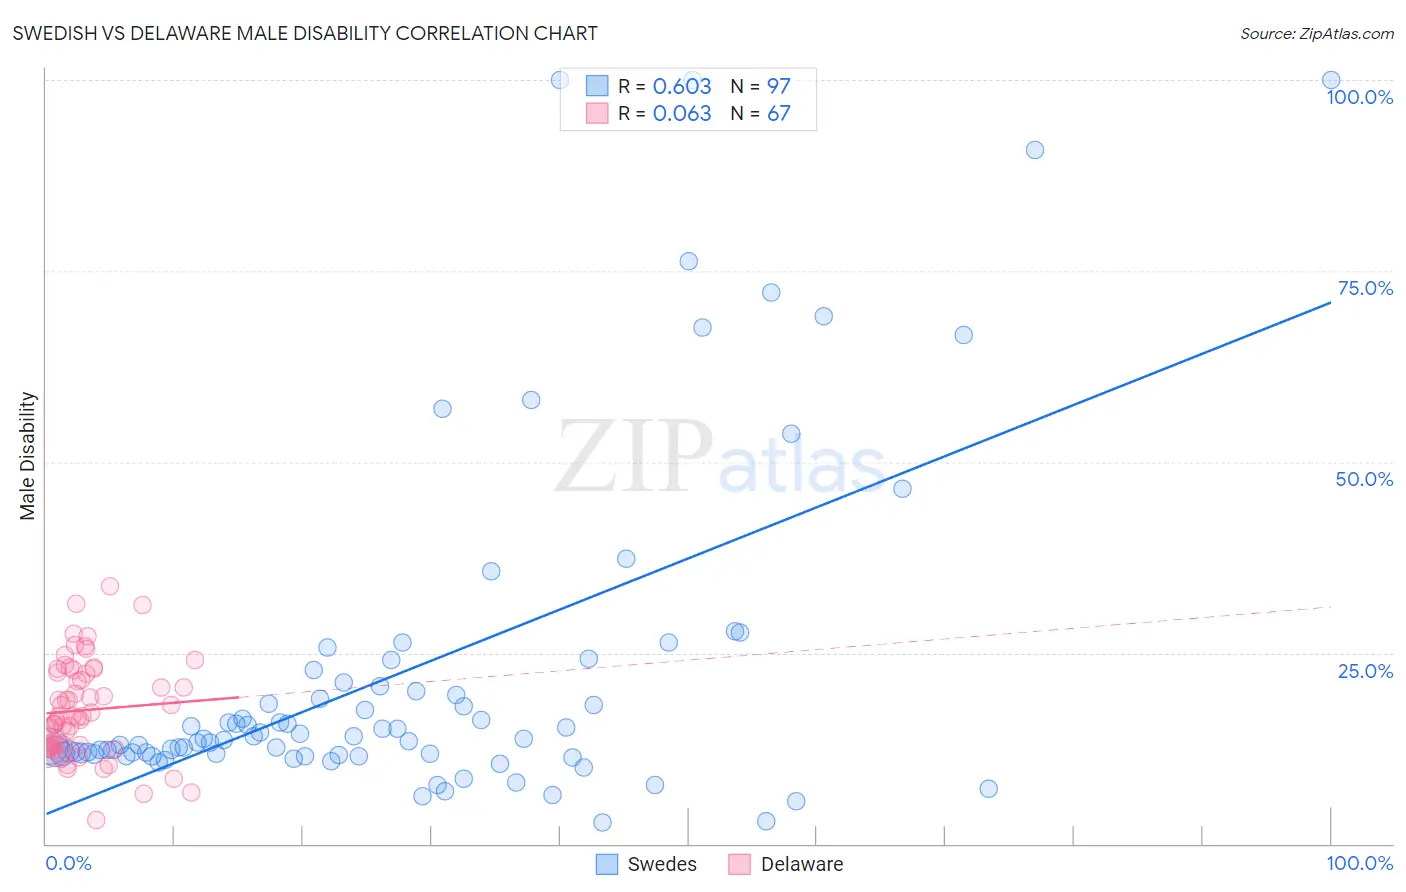
Swedish vs Delaware Male Disability Correlation Chart
The statistical analysis conducted on geographies consisting of 539,057,565 people shows a significant positive correlation between the proportion of Swedes and percentage of males with a disability in the United States with a correlation coefficient (R) of 0.603 and weighted average of 12.1%. Similarly, the statistical analysis conducted on geographies consisting of 96,239,516 people shows a slight positive correlation between the proportion of Delaware and percentage of males with a disability in the United States with a correlation coefficient (R) of 0.063 and weighted average of 13.5%, a difference of 11.0%.
Male Disability Correlation Summary
| Measurement | Swedish | Delaware |
| Minimum | 2.9% | 3.1% |
| Maximum | 100.0% | 33.7% |
| Range | 97.1% | 30.6% |
| Mean | 22.4% | 17.5% |
| Median | 13.7% | 16.6% |
| Interquartile 25% (IQ1) | 11.7% | 12.7% |
| Interquartile 75% (IQ3) | 20.8% | 22.4% |
| Interquartile Range (IQR) | 9.1% | 9.7% |
| Standard Deviation (Sample) | 22.1% | 6.3% |
| Standard Deviation (Population) | 22.0% | 6.2% |
Similar Demographics by Male Disability
Demographics Similar to Swedes by Male Disability
In terms of male disability, the demographic groups most similar to Swedes are Belgian (12.1%, a difference of 0.070%), Basque (12.1%, a difference of 0.12%), Swiss (12.1%, a difference of 0.31%), European (12.1%, a difference of 0.31%), and Slavic (12.2%, a difference of 0.36%).
| Demographics | Rating | Rank | Male Disability |
| Guamanians/Chamorros | 0.5 /100 | #253 | Tragic 12.0% |
| British | 0.4 /100 | #254 | Tragic 12.1% |
| Chinese | 0.4 /100 | #255 | Tragic 12.1% |
| Swiss | 0.3 /100 | #256 | Tragic 12.1% |
| Europeans | 0.3 /100 | #257 | Tragic 12.1% |
| Basques | 0.3 /100 | #258 | Tragic 12.1% |
| Belgians | 0.3 /100 | #259 | Tragic 12.1% |
| Swedes | 0.3 /100 | #260 | Tragic 12.1% |
| Slavs | 0.2 /100 | #261 | Tragic 12.2% |
| Norwegians | 0.2 /100 | #262 | Tragic 12.2% |
| Canadians | 0.2 /100 | #263 | Tragic 12.2% |
| Nepalese | 0.2 /100 | #264 | Tragic 12.2% |
| Immigrants | Portugal | 0.1 /100 | #265 | Tragic 12.3% |
| Hawaiians | 0.1 /100 | #266 | Tragic 12.3% |
| Immigrants | Germany | 0.1 /100 | #267 | Tragic 12.3% |
Demographics Similar to Delaware by Male Disability
In terms of male disability, the demographic groups most similar to Delaware are Immigrants from the Azores (13.4%, a difference of 0.19%), Blackfeet (13.4%, a difference of 0.33%), Yakama (13.5%, a difference of 0.55%), Puget Sound Salish (13.5%, a difference of 0.57%), and Aleut (13.5%, a difference of 0.63%).
| Demographics | Rating | Rank | Male Disability |
| Blacks/African Americans | 0.0 /100 | #304 | Tragic 13.2% |
| French Canadians | 0.0 /100 | #305 | Tragic 13.3% |
| Spanish Americans | 0.0 /100 | #306 | Tragic 13.3% |
| Arapaho | 0.0 /100 | #307 | Tragic 13.3% |
| French American Indians | 0.0 /100 | #308 | Tragic 13.4% |
| Blackfeet | 0.0 /100 | #309 | Tragic 13.4% |
| Immigrants | Azores | 0.0 /100 | #310 | Tragic 13.4% |
| Delaware | 0.0 /100 | #311 | Tragic 13.5% |
| Yakama | 0.0 /100 | #312 | Tragic 13.5% |
| Puget Sound Salish | 0.0 /100 | #313 | Tragic 13.5% |
| Aleuts | 0.0 /100 | #314 | Tragic 13.5% |
| Iroquois | 0.0 /100 | #315 | Tragic 13.6% |
| Alaska Natives | 0.0 /100 | #316 | Tragic 13.6% |
| Paiute | 0.0 /100 | #317 | Tragic 13.7% |
| Cree | 0.0 /100 | #318 | Tragic 13.7% |