Swedish vs Cuban Male Disability
COMPARE
Swedish
Cuban
Male Disability
Male Disability Comparison
Swedes
Cubans
12.1%
MALE DISABILITY
0.3/ 100
METRIC RATING
260th/ 347
METRIC RANK
11.0%
MALE DISABILITY
74.9/ 100
METRIC RATING
151st/ 347
METRIC RANK
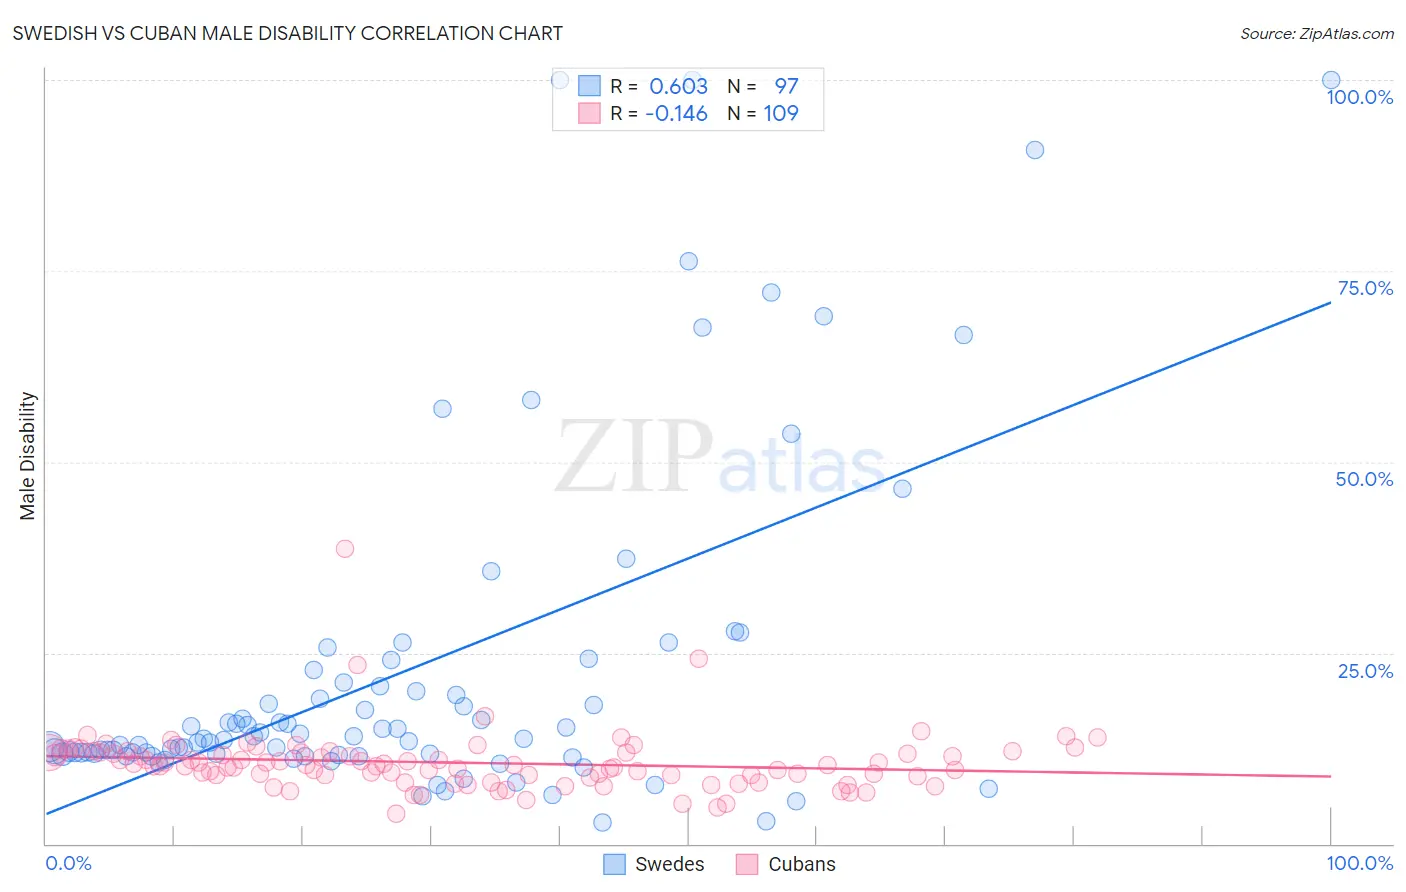
Swedish vs Cuban Male Disability Correlation Chart
The statistical analysis conducted on geographies consisting of 539,057,565 people shows a significant positive correlation between the proportion of Swedes and percentage of males with a disability in the United States with a correlation coefficient (R) of 0.603 and weighted average of 12.1%. Similarly, the statistical analysis conducted on geographies consisting of 449,227,297 people shows a poor negative correlation between the proportion of Cubans and percentage of males with a disability in the United States with a correlation coefficient (R) of -0.146 and weighted average of 11.0%, a difference of 9.8%.
Male Disability Correlation Summary
| Measurement | Swedish | Cuban |
| Minimum | 2.9% | 3.9% |
| Maximum | 100.0% | 38.6% |
| Range | 97.1% | 34.7% |
| Mean | 22.4% | 10.6% |
| Median | 13.7% | 10.2% |
| Interquartile 25% (IQ1) | 11.7% | 8.9% |
| Interquartile 75% (IQ3) | 20.8% | 11.9% |
| Interquartile Range (IQR) | 9.1% | 3.0% |
| Standard Deviation (Sample) | 22.1% | 4.0% |
| Standard Deviation (Population) | 22.0% | 4.0% |
Similar Demographics by Male Disability
Demographics Similar to Swedes by Male Disability
In terms of male disability, the demographic groups most similar to Swedes are Belgian (12.1%, a difference of 0.070%), Basque (12.1%, a difference of 0.12%), Swiss (12.1%, a difference of 0.31%), European (12.1%, a difference of 0.31%), and Slavic (12.2%, a difference of 0.36%).
| Demographics | Rating | Rank | Male Disability |
| Guamanians/Chamorros | 0.5 /100 | #253 | Tragic 12.0% |
| British | 0.4 /100 | #254 | Tragic 12.1% |
| Chinese | 0.4 /100 | #255 | Tragic 12.1% |
| Swiss | 0.3 /100 | #256 | Tragic 12.1% |
| Europeans | 0.3 /100 | #257 | Tragic 12.1% |
| Basques | 0.3 /100 | #258 | Tragic 12.1% |
| Belgians | 0.3 /100 | #259 | Tragic 12.1% |
| Swedes | 0.3 /100 | #260 | Tragic 12.1% |
| Slavs | 0.2 /100 | #261 | Tragic 12.2% |
| Norwegians | 0.2 /100 | #262 | Tragic 12.2% |
| Canadians | 0.2 /100 | #263 | Tragic 12.2% |
| Nepalese | 0.2 /100 | #264 | Tragic 12.2% |
| Immigrants | Portugal | 0.1 /100 | #265 | Tragic 12.3% |
| Hawaiians | 0.1 /100 | #266 | Tragic 12.3% |
| Immigrants | Germany | 0.1 /100 | #267 | Tragic 12.3% |
Demographics Similar to Cubans by Male Disability
In terms of male disability, the demographic groups most similar to Cubans are Immigrants from Guatemala (11.0%, a difference of 0.020%), Immigrants from Albania (11.0%, a difference of 0.030%), Immigrants from Denmark (11.0%, a difference of 0.12%), Immigrants from Northern Europe (11.1%, a difference of 0.12%), and Immigrants from Moldova (11.1%, a difference of 0.15%).
| Demographics | Rating | Rank | Male Disability |
| Kenyans | 78.1 /100 | #144 | Good 11.0% |
| Costa Ricans | 78.0 /100 | #145 | Good 11.0% |
| Koreans | 77.5 /100 | #146 | Good 11.0% |
| Immigrants | Croatia | 77.3 /100 | #147 | Good 11.0% |
| Sudanese | 77.1 /100 | #148 | Good 11.0% |
| Immigrants | Denmark | 76.4 /100 | #149 | Good 11.0% |
| Immigrants | Guatemala | 75.1 /100 | #150 | Good 11.0% |
| Cubans | 74.9 /100 | #151 | Good 11.0% |
| Immigrants | Albania | 74.4 /100 | #152 | Good 11.0% |
| Immigrants | Northern Europe | 73.2 /100 | #153 | Good 11.1% |
| Immigrants | Moldova | 72.8 /100 | #154 | Good 11.1% |
| Immigrants | Middle Africa | 70.9 /100 | #155 | Good 11.1% |
| Russians | 69.8 /100 | #156 | Good 11.1% |
| Immigrants | Western Africa | 69.2 /100 | #157 | Good 11.1% |
| Latvians | 68.1 /100 | #158 | Good 11.1% |