Swedish vs Ecuadorian Male Disability
COMPARE
Swedish
Ecuadorian
Male Disability
Male Disability Comparison
Swedes
Ecuadorians
12.1%
MALE DISABILITY
0.3/ 100
METRIC RATING
260th/ 347
METRIC RANK
10.5%
MALE DISABILITY
99.2/ 100
METRIC RATING
69th/ 347
METRIC RANK
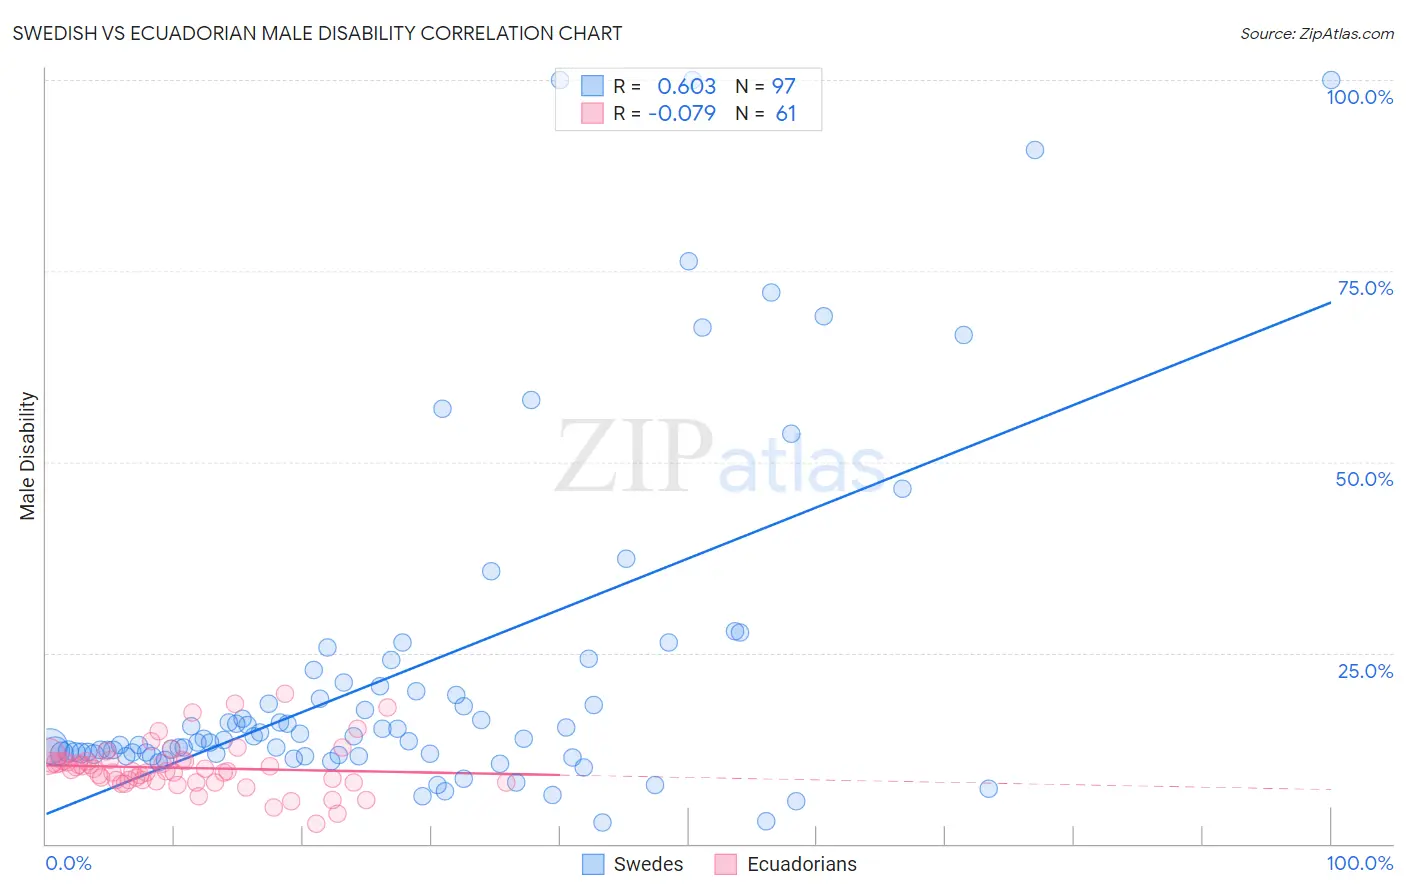
Swedish vs Ecuadorian Male Disability Correlation Chart
The statistical analysis conducted on geographies consisting of 539,057,565 people shows a significant positive correlation between the proportion of Swedes and percentage of males with a disability in the United States with a correlation coefficient (R) of 0.603 and weighted average of 12.1%. Similarly, the statistical analysis conducted on geographies consisting of 317,801,764 people shows a slight negative correlation between the proportion of Ecuadorians and percentage of males with a disability in the United States with a correlation coefficient (R) of -0.079 and weighted average of 10.5%, a difference of 15.9%.
Male Disability Correlation Summary
| Measurement | Swedish | Ecuadorian |
| Minimum | 2.9% | 2.6% |
| Maximum | 100.0% | 19.6% |
| Range | 97.1% | 17.0% |
| Mean | 22.4% | 9.9% |
| Median | 13.7% | 9.5% |
| Interquartile 25% (IQ1) | 11.7% | 8.2% |
| Interquartile 75% (IQ3) | 20.8% | 10.8% |
| Interquartile Range (IQR) | 9.1% | 2.7% |
| Standard Deviation (Sample) | 22.1% | 3.2% |
| Standard Deviation (Population) | 22.0% | 3.2% |
Similar Demographics by Male Disability
Demographics Similar to Swedes by Male Disability
In terms of male disability, the demographic groups most similar to Swedes are Belgian (12.1%, a difference of 0.070%), Basque (12.1%, a difference of 0.12%), Swiss (12.1%, a difference of 0.31%), European (12.1%, a difference of 0.31%), and Slavic (12.2%, a difference of 0.36%).
| Demographics | Rating | Rank | Male Disability |
| Guamanians/Chamorros | 0.5 /100 | #253 | Tragic 12.0% |
| British | 0.4 /100 | #254 | Tragic 12.1% |
| Chinese | 0.4 /100 | #255 | Tragic 12.1% |
| Swiss | 0.3 /100 | #256 | Tragic 12.1% |
| Europeans | 0.3 /100 | #257 | Tragic 12.1% |
| Basques | 0.3 /100 | #258 | Tragic 12.1% |
| Belgians | 0.3 /100 | #259 | Tragic 12.1% |
| Swedes | 0.3 /100 | #260 | Tragic 12.1% |
| Slavs | 0.2 /100 | #261 | Tragic 12.2% |
| Norwegians | 0.2 /100 | #262 | Tragic 12.2% |
| Canadians | 0.2 /100 | #263 | Tragic 12.2% |
| Nepalese | 0.2 /100 | #264 | Tragic 12.2% |
| Immigrants | Portugal | 0.1 /100 | #265 | Tragic 12.3% |
| Hawaiians | 0.1 /100 | #266 | Tragic 12.3% |
| Immigrants | Germany | 0.1 /100 | #267 | Tragic 12.3% |
Demographics Similar to Ecuadorians by Male Disability
In terms of male disability, the demographic groups most similar to Ecuadorians are Colombian (10.5%, a difference of 0.0%), Immigrants from Afghanistan (10.5%, a difference of 0.10%), Immigrants from Grenada (10.5%, a difference of 0.11%), Guyanese (10.5%, a difference of 0.11%), and Jordanian (10.5%, a difference of 0.13%).
| Demographics | Rating | Rank | Male Disability |
| Immigrants | Ecuador | 99.3 /100 | #62 | Exceptional 10.4% |
| Immigrants | Belarus | 99.3 /100 | #63 | Exceptional 10.4% |
| Jordanians | 99.3 /100 | #64 | Exceptional 10.5% |
| Immigrants | Grenada | 99.2 /100 | #65 | Exceptional 10.5% |
| Guyanese | 99.2 /100 | #66 | Exceptional 10.5% |
| Immigrants | Afghanistan | 99.2 /100 | #67 | Exceptional 10.5% |
| Colombians | 99.2 /100 | #68 | Exceptional 10.5% |
| Ecuadorians | 99.2 /100 | #69 | Exceptional 10.5% |
| Immigrants | Bulgaria | 99.1 /100 | #70 | Exceptional 10.5% |
| Immigrants | Cameroon | 99.0 /100 | #71 | Exceptional 10.5% |
| Immigrants | Serbia | 99.0 /100 | #72 | Exceptional 10.5% |
| Immigrants | Lithuania | 98.9 /100 | #73 | Exceptional 10.5% |
| Immigrants | Lebanon | 98.8 /100 | #74 | Exceptional 10.5% |
| Sierra Leoneans | 98.7 /100 | #75 | Exceptional 10.5% |
| Immigrants | Sierra Leone | 98.7 /100 | #76 | Exceptional 10.5% |