Sudanese vs Immigrants from Ethiopia 9th Grade
COMPARE
Sudanese
Immigrants from Ethiopia
9th Grade
9th Grade Comparison
Sudanese
Immigrants from Ethiopia
94.7%
9TH GRADE
32.7/ 100
METRIC RATING
190th/ 347
METRIC RANK
94.3%
9TH GRADE
2.7/ 100
METRIC RATING
240th/ 347
METRIC RANK
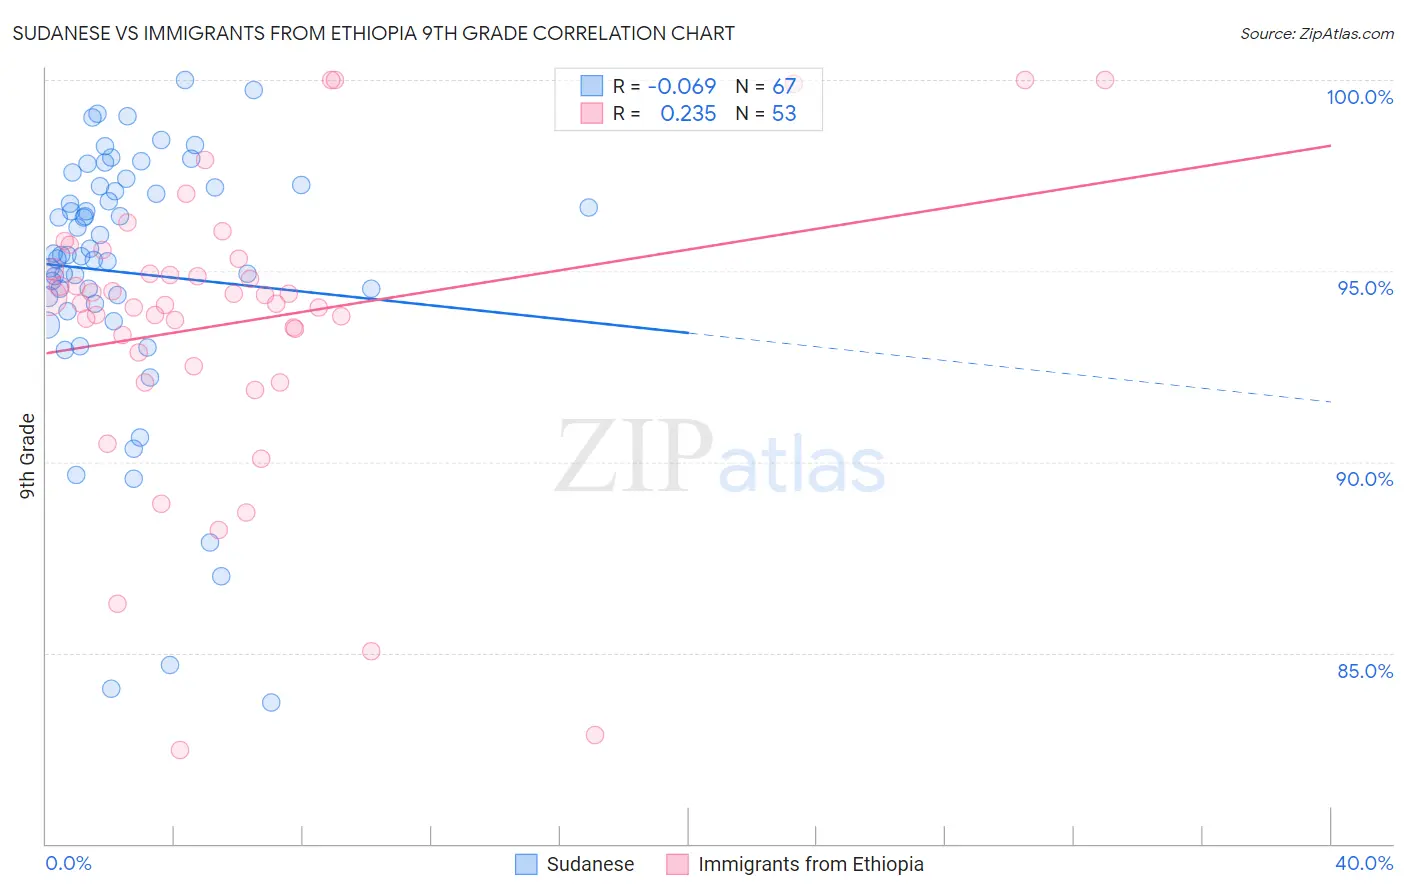
Sudanese vs Immigrants from Ethiopia 9th Grade Correlation Chart
The statistical analysis conducted on geographies consisting of 110,134,719 people shows a slight negative correlation between the proportion of Sudanese and percentage of population with at least 9th grade education in the United States with a correlation coefficient (R) of -0.069 and weighted average of 94.7%. Similarly, the statistical analysis conducted on geographies consisting of 211,528,629 people shows a weak positive correlation between the proportion of Immigrants from Ethiopia and percentage of population with at least 9th grade education in the United States with a correlation coefficient (R) of 0.235 and weighted average of 94.3%, a difference of 0.53%.
9th Grade Correlation Summary
| Measurement | Sudanese | Immigrants from Ethiopia |
| Minimum | 83.7% | 82.4% |
| Maximum | 100.0% | 100.0% |
| Range | 16.3% | 17.6% |
| Mean | 95.0% | 93.7% |
| Median | 95.4% | 94.1% |
| Interquartile 25% (IQ1) | 94.1% | 92.7% |
| Interquartile 75% (IQ3) | 97.2% | 95.2% |
| Interquartile Range (IQR) | 3.1% | 2.5% |
| Standard Deviation (Sample) | 3.5% | 3.8% |
| Standard Deviation (Population) | 3.5% | 3.8% |
Similar Demographics by 9th Grade
Demographics Similar to Sudanese by 9th Grade
In terms of 9th grade, the demographic groups most similar to Sudanese are Immigrants from Argentina (94.8%, a difference of 0.010%), Assyrian/Chaldean/Syriac (94.7%, a difference of 0.010%), Guamanian/Chamorro (94.8%, a difference of 0.020%), Immigrants from Albania (94.8%, a difference of 0.020%), and Immigrants from Northern Africa (94.7%, a difference of 0.020%).
| Demographics | Rating | Rank | 9th Grade |
| Immigrants | Nepal | 39.7 /100 | #183 | Fair 94.8% |
| Argentineans | 37.6 /100 | #184 | Fair 94.8% |
| Liberians | 37.4 /100 | #185 | Fair 94.8% |
| Hopi | 37.1 /100 | #186 | Fair 94.8% |
| Guamanians/Chamorros | 35.5 /100 | #187 | Fair 94.8% |
| Immigrants | Albania | 34.5 /100 | #188 | Fair 94.8% |
| Immigrants | Argentina | 34.4 /100 | #189 | Fair 94.8% |
| Sudanese | 32.7 /100 | #190 | Fair 94.7% |
| Assyrians/Chaldeans/Syriacs | 32.0 /100 | #191 | Fair 94.7% |
| Immigrants | Northern Africa | 30.7 /100 | #192 | Fair 94.7% |
| Paraguayans | 30.1 /100 | #193 | Fair 94.7% |
| Panamanians | 29.0 /100 | #194 | Fair 94.7% |
| Marshallese | 27.9 /100 | #195 | Fair 94.7% |
| Immigrants | Lebanon | 27.2 /100 | #196 | Fair 94.7% |
| Immigrants | Micronesia | 24.7 /100 | #197 | Fair 94.7% |
Demographics Similar to Immigrants from Ethiopia by 9th Grade
In terms of 9th grade, the demographic groups most similar to Immigrants from Ethiopia are Spanish American (94.2%, a difference of 0.0%), Korean (94.3%, a difference of 0.010%), South American Indian (94.3%, a difference of 0.010%), Immigrants from China (94.3%, a difference of 0.010%), and Somali (94.3%, a difference of 0.020%).
| Demographics | Rating | Rank | 9th Grade |
| Nigerians | 3.7 /100 | #233 | Tragic 94.3% |
| Costa Ricans | 3.5 /100 | #234 | Tragic 94.3% |
| Bolivians | 3.3 /100 | #235 | Tragic 94.3% |
| Somalis | 2.9 /100 | #236 | Tragic 94.3% |
| Koreans | 2.9 /100 | #237 | Tragic 94.3% |
| South American Indians | 2.8 /100 | #238 | Tragic 94.3% |
| Immigrants | China | 2.8 /100 | #239 | Tragic 94.3% |
| Immigrants | Ethiopia | 2.7 /100 | #240 | Tragic 94.3% |
| Spanish Americans | 2.6 /100 | #241 | Tragic 94.2% |
| Immigrants | Middle Africa | 2.2 /100 | #242 | Tragic 94.2% |
| Immigrants | Cameroon | 2.1 /100 | #243 | Tragic 94.2% |
| Dutch West Indians | 2.0 /100 | #244 | Tragic 94.2% |
| Paiute | 1.9 /100 | #245 | Tragic 94.2% |
| Senegalese | 1.9 /100 | #246 | Tragic 94.2% |
| Afghans | 1.8 /100 | #247 | Tragic 94.2% |