Sudanese vs Immigrants from Ethiopia Unemployment Among Ages 25 to 29 years
COMPARE
Sudanese
Immigrants from Ethiopia
Unemployment Among Ages 25 to 29 years
Unemployment Among Ages 25 to 29 years Comparison
Sudanese
Immigrants from Ethiopia
5.4%
UNEMPLOYMENT AMONG AGES 25 TO 29 YEARS
100.0/ 100
METRIC RATING
1st/ 347
METRIC RANK
6.0%
UNEMPLOYMENT AMONG AGES 25 TO 29 YEARS
99.9/ 100
METRIC RATING
21st/ 347
METRIC RANK
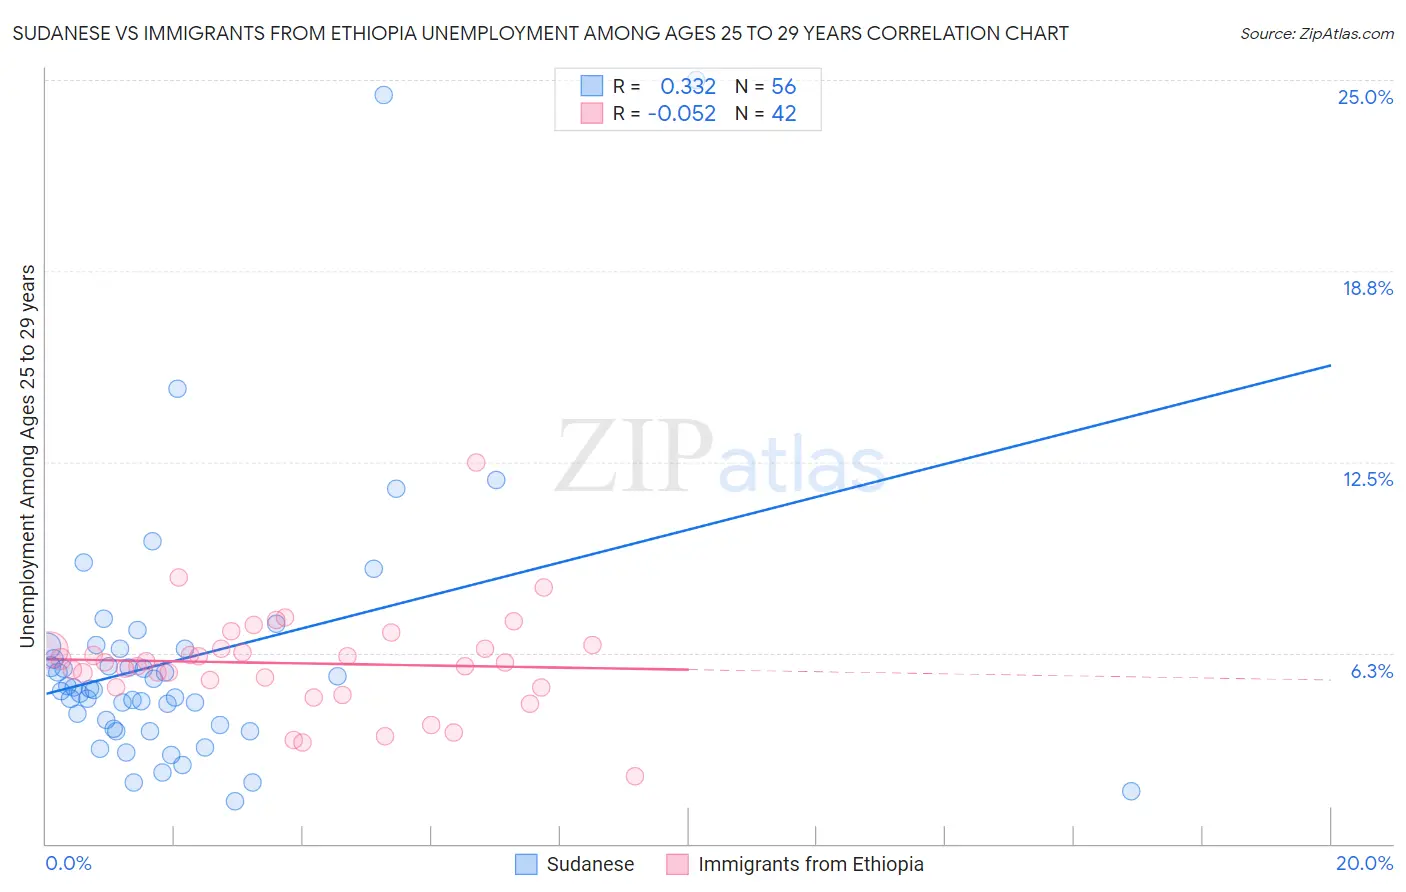
Sudanese vs Immigrants from Ethiopia Unemployment Among Ages 25 to 29 years Correlation Chart
The statistical analysis conducted on geographies consisting of 108,696,537 people shows a mild positive correlation between the proportion of Sudanese and unemployment rate among population between the ages 25 and 29 in the United States with a correlation coefficient (R) of 0.332 and weighted average of 5.4%. Similarly, the statistical analysis conducted on geographies consisting of 206,943,283 people shows a slight negative correlation between the proportion of Immigrants from Ethiopia and unemployment rate among population between the ages 25 and 29 in the United States with a correlation coefficient (R) of -0.052 and weighted average of 6.0%, a difference of 10.9%.
Unemployment Among Ages 25 to 29 years Correlation Summary
| Measurement | Sudanese | Immigrants from Ethiopia |
| Minimum | 1.4% | 2.2% |
| Maximum | 25.0% | 12.5% |
| Range | 23.6% | 10.3% |
| Mean | 6.1% | 5.9% |
| Median | 5.0% | 5.9% |
| Interquartile 25% (IQ1) | 3.8% | 5.1% |
| Interquartile 75% (IQ3) | 6.4% | 6.4% |
| Interquartile Range (IQR) | 2.6% | 1.3% |
| Standard Deviation (Sample) | 4.4% | 1.7% |
| Standard Deviation (Population) | 4.4% | 1.7% |
Demographics Similar to Sudanese and Immigrants from Ethiopia by Unemployment Among Ages 25 to 29 years
In terms of unemployment among ages 25 to 29 years, the demographic groups most similar to Sudanese are Tongan (5.5%, a difference of 2.5%), Immigrants from Somalia (5.5%, a difference of 2.8%), Immigrants from Cuba (5.6%, a difference of 4.9%), Somali (5.6%, a difference of 5.0%), and Hmong (5.7%, a difference of 5.2%). Similarly, the demographic groups most similar to Immigrants from Ethiopia are Immigrants from Eritrea (5.9%, a difference of 0.34%), Thai (5.9%, a difference of 0.53%), Immigrants from Singapore (5.9%, a difference of 0.68%), Bolivian (5.9%, a difference of 0.79%), and Immigrants from Bulgaria (5.9%, a difference of 0.93%).
| Demographics | Rating | Rank | Unemployment Among Ages 25 to 29 years |
| Sudanese | 100.0 /100 | #1 | Exceptional 5.4% |
| Tongans | 100.0 /100 | #2 | Exceptional 5.5% |
| Immigrants | Somalia | 100.0 /100 | #3 | Exceptional 5.5% |
| Immigrants | Cuba | 100.0 /100 | #4 | Exceptional 5.6% |
| Somalis | 100.0 /100 | #5 | Exceptional 5.6% |
| Hmong | 100.0 /100 | #6 | Exceptional 5.7% |
| Immigrants | India | 100.0 /100 | #7 | Exceptional 5.7% |
| Immigrants | Bosnia and Herzegovina | 100.0 /100 | #8 | Exceptional 5.7% |
| Immigrants | Nepal | 100.0 /100 | #9 | Exceptional 5.7% |
| Immigrants | Sudan | 100.0 /100 | #10 | Exceptional 5.8% |
| Cambodians | 100.0 /100 | #11 | Exceptional 5.8% |
| Okinawans | 100.0 /100 | #12 | Exceptional 5.9% |
| Immigrants | Bolivia | 100.0 /100 | #13 | Exceptional 5.9% |
| Immigrants | Kuwait | 99.9 /100 | #14 | Exceptional 5.9% |
| Cubans | 99.9 /100 | #15 | Exceptional 5.9% |
| Immigrants | Bulgaria | 99.9 /100 | #16 | Exceptional 5.9% |
| Bolivians | 99.9 /100 | #17 | Exceptional 5.9% |
| Immigrants | Singapore | 99.9 /100 | #18 | Exceptional 5.9% |
| Thais | 99.9 /100 | #19 | Exceptional 5.9% |
| Immigrants | Eritrea | 99.9 /100 | #20 | Exceptional 5.9% |
| Immigrants | Ethiopia | 99.9 /100 | #21 | Exceptional 6.0% |