Sudanese vs Kiowa Disability Age 5 to 17
COMPARE
Sudanese
Kiowa
Disability Age 5 to 17
Disability Age 5 to 17 Comparison
Sudanese
Kiowa
5.8%
DISABILITY AGE 5 TO 17
2.9/ 100
METRIC RATING
237th/ 347
METRIC RANK
6.4%
DISABILITY AGE 5 TO 17
0.0/ 100
METRIC RATING
317th/ 347
METRIC RANK
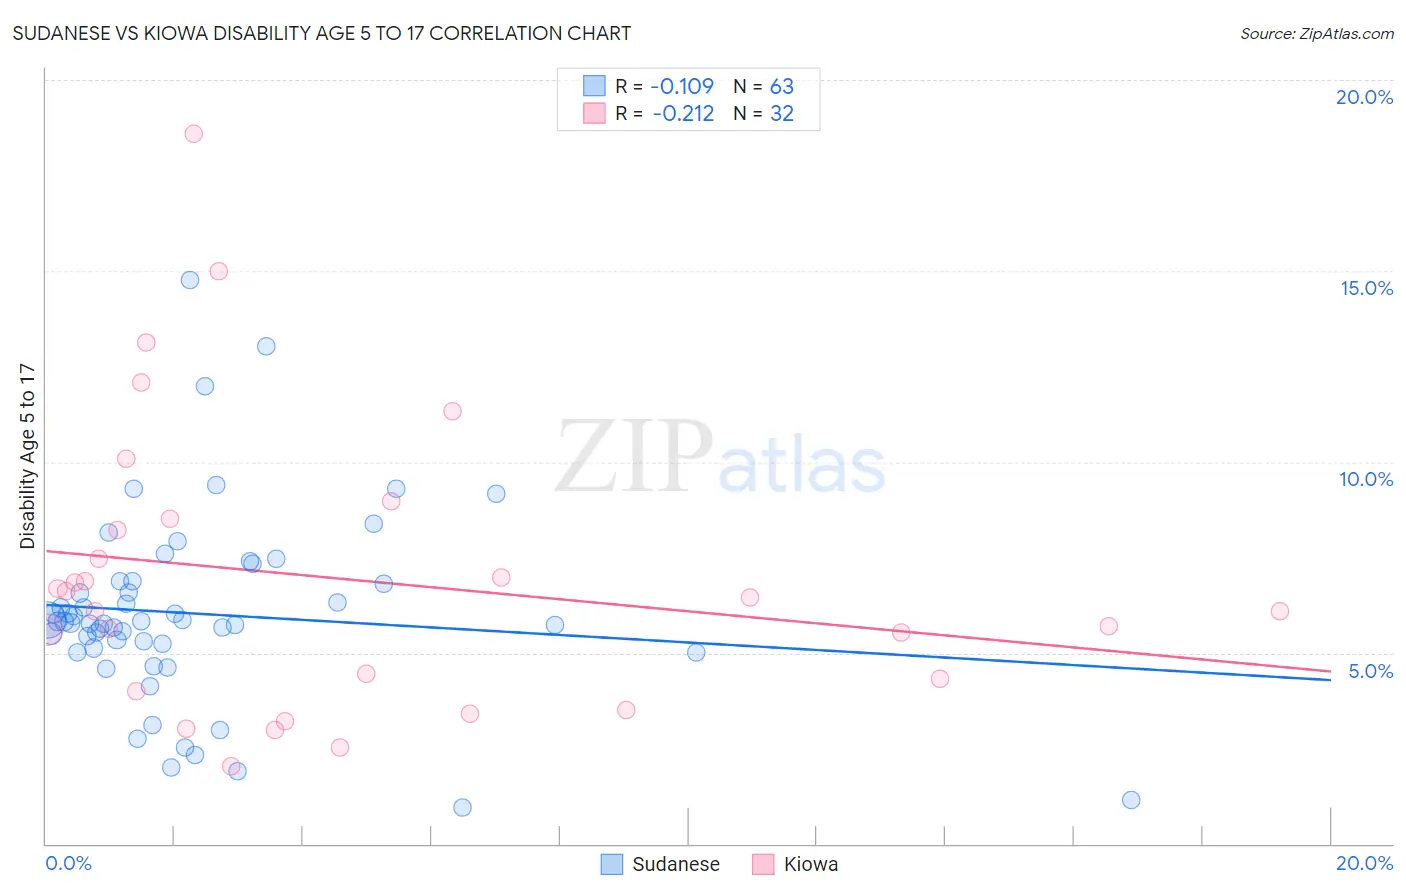
Sudanese vs Kiowa Disability Age 5 to 17 Correlation Chart
The statistical analysis conducted on geographies consisting of 109,989,475 people shows a poor negative correlation between the proportion of Sudanese and percentage of population with a disability between the ages 5 and 17 in the United States with a correlation coefficient (R) of -0.109 and weighted average of 5.8%. Similarly, the statistical analysis conducted on geographies consisting of 55,978,349 people shows a weak negative correlation between the proportion of Kiowa and percentage of population with a disability between the ages 5 and 17 in the United States with a correlation coefficient (R) of -0.212 and weighted average of 6.4%, a difference of 10.3%.
Disability Age 5 to 17 Correlation Summary
| Measurement | Sudanese | Kiowa |
| Minimum | 0.94% | 2.0% |
| Maximum | 14.8% | 18.6% |
| Range | 13.8% | 16.6% |
| Mean | 6.0% | 6.9% |
| Median | 5.8% | 6.3% |
| Interquartile 25% (IQ1) | 5.1% | 4.2% |
| Interquartile 75% (IQ3) | 6.9% | 8.4% |
| Interquartile Range (IQR) | 1.7% | 4.2% |
| Standard Deviation (Sample) | 2.5% | 3.8% |
| Standard Deviation (Population) | 2.5% | 3.7% |
Similar Demographics by Disability Age 5 to 17
Demographics Similar to Sudanese by Disability Age 5 to 17
In terms of disability age 5 to 17, the demographic groups most similar to Sudanese are Hungarian (5.8%, a difference of 0.10%), Immigrants from Brazil (5.8%, a difference of 0.15%), German Russian (5.9%, a difference of 0.20%), Malaysian (5.8%, a difference of 0.21%), and Immigrants from Kenya (5.8%, a difference of 0.22%).
| Demographics | Rating | Rank | Disability Age 5 to 17 |
| Ghanaians | 4.7 /100 | #230 | Tragic 5.8% |
| Europeans | 4.5 /100 | #231 | Tragic 5.8% |
| Immigrants | Laos | 3.8 /100 | #232 | Tragic 5.8% |
| Immigrants | West Indies | 3.5 /100 | #233 | Tragic 5.8% |
| Immigrants | Kenya | 3.4 /100 | #234 | Tragic 5.8% |
| Malaysians | 3.4 /100 | #235 | Tragic 5.8% |
| Immigrants | Brazil | 3.2 /100 | #236 | Tragic 5.8% |
| Sudanese | 2.9 /100 | #237 | Tragic 5.8% |
| Hungarians | 2.6 /100 | #238 | Tragic 5.8% |
| German Russians | 2.4 /100 | #239 | Tragic 5.9% |
| West Indians | 2.4 /100 | #240 | Tragic 5.9% |
| Immigrants | Caribbean | 2.1 /100 | #241 | Tragic 5.9% |
| Spaniards | 2.0 /100 | #242 | Tragic 5.9% |
| Indonesians | 2.0 /100 | #243 | Tragic 5.9% |
| Immigrants | Germany | 1.9 /100 | #244 | Tragic 5.9% |
Demographics Similar to Kiowa by Disability Age 5 to 17
In terms of disability age 5 to 17, the demographic groups most similar to Kiowa are Comanche (6.4%, a difference of 0.030%), Immigrants from Dominican Republic (6.4%, a difference of 0.13%), Immigrants from Portugal (6.4%, a difference of 0.31%), French (6.4%, a difference of 0.48%), and Delaware (6.5%, a difference of 0.58%).
| Demographics | Rating | Rank | Disability Age 5 to 17 |
| Alaskan Athabascans | 0.0 /100 | #310 | Tragic 6.3% |
| Immigrants | Dominica | 0.0 /100 | #311 | Tragic 6.3% |
| Bermudans | 0.0 /100 | #312 | Tragic 6.4% |
| Apache | 0.0 /100 | #313 | Tragic 6.4% |
| French | 0.0 /100 | #314 | Tragic 6.4% |
| Immigrants | Portugal | 0.0 /100 | #315 | Tragic 6.4% |
| Immigrants | Dominican Republic | 0.0 /100 | #316 | Tragic 6.4% |
| Kiowa | 0.0 /100 | #317 | Tragic 6.4% |
| Comanche | 0.0 /100 | #318 | Tragic 6.4% |
| Delaware | 0.0 /100 | #319 | Tragic 6.5% |
| Africans | 0.0 /100 | #320 | Tragic 6.5% |
| Tohono O'odham | 0.0 /100 | #321 | Tragic 6.5% |
| Slovaks | 0.0 /100 | #322 | Tragic 6.5% |
| Osage | 0.0 /100 | #323 | Tragic 6.5% |
| Dominicans | 0.0 /100 | #324 | Tragic 6.5% |