Sudanese vs Pueblo Disability Age 5 to 17
COMPARE
Sudanese
Pueblo
Disability Age 5 to 17
Disability Age 5 to 17 Comparison
Sudanese
Pueblo
5.8%
DISABILITY AGE 5 TO 17
2.9/ 100
METRIC RATING
237th/ 347
METRIC RANK
5.7%
DISABILITY AGE 5 TO 17
27.5/ 100
METRIC RATING
189th/ 347
METRIC RANK
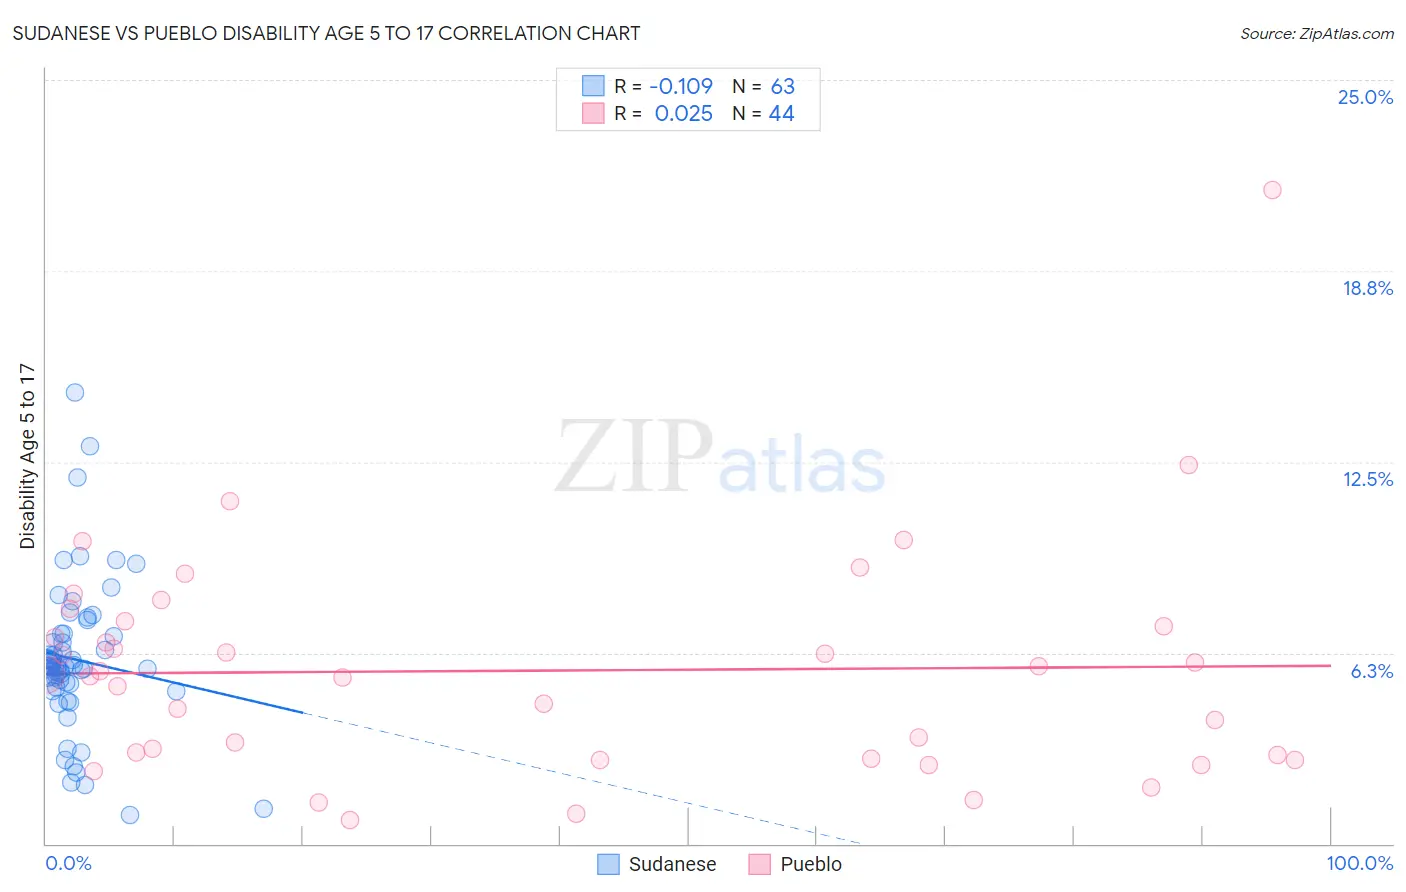
Sudanese vs Pueblo Disability Age 5 to 17 Correlation Chart
The statistical analysis conducted on geographies consisting of 109,989,475 people shows a poor negative correlation between the proportion of Sudanese and percentage of population with a disability between the ages 5 and 17 in the United States with a correlation coefficient (R) of -0.109 and weighted average of 5.8%. Similarly, the statistical analysis conducted on geographies consisting of 119,704,648 people shows no correlation between the proportion of Pueblo and percentage of population with a disability between the ages 5 and 17 in the United States with a correlation coefficient (R) of 0.025 and weighted average of 5.7%, a difference of 3.1%.
Disability Age 5 to 17 Correlation Summary
| Measurement | Sudanese | Pueblo |
| Minimum | 0.94% | 0.78% |
| Maximum | 14.8% | 21.4% |
| Range | 13.8% | 20.6% |
| Mean | 6.0% | 5.7% |
| Median | 5.8% | 5.5% |
| Interquartile 25% (IQ1) | 5.1% | 2.8% |
| Interquartile 75% (IQ3) | 6.9% | 7.2% |
| Interquartile Range (IQR) | 1.7% | 4.3% |
| Standard Deviation (Sample) | 2.5% | 3.7% |
| Standard Deviation (Population) | 2.5% | 3.7% |
Similar Demographics by Disability Age 5 to 17
Demographics Similar to Sudanese by Disability Age 5 to 17
In terms of disability age 5 to 17, the demographic groups most similar to Sudanese are Hungarian (5.8%, a difference of 0.10%), Immigrants from Brazil (5.8%, a difference of 0.15%), German Russian (5.9%, a difference of 0.20%), Malaysian (5.8%, a difference of 0.21%), and Immigrants from Kenya (5.8%, a difference of 0.22%).
| Demographics | Rating | Rank | Disability Age 5 to 17 |
| Ghanaians | 4.7 /100 | #230 | Tragic 5.8% |
| Europeans | 4.5 /100 | #231 | Tragic 5.8% |
| Immigrants | Laos | 3.8 /100 | #232 | Tragic 5.8% |
| Immigrants | West Indies | 3.5 /100 | #233 | Tragic 5.8% |
| Immigrants | Kenya | 3.4 /100 | #234 | Tragic 5.8% |
| Malaysians | 3.4 /100 | #235 | Tragic 5.8% |
| Immigrants | Brazil | 3.2 /100 | #236 | Tragic 5.8% |
| Sudanese | 2.9 /100 | #237 | Tragic 5.8% |
| Hungarians | 2.6 /100 | #238 | Tragic 5.8% |
| German Russians | 2.4 /100 | #239 | Tragic 5.9% |
| West Indians | 2.4 /100 | #240 | Tragic 5.9% |
| Immigrants | Caribbean | 2.1 /100 | #241 | Tragic 5.9% |
| Spaniards | 2.0 /100 | #242 | Tragic 5.9% |
| Indonesians | 2.0 /100 | #243 | Tragic 5.9% |
| Immigrants | Germany | 1.9 /100 | #244 | Tragic 5.9% |
Demographics Similar to Pueblo by Disability Age 5 to 17
In terms of disability age 5 to 17, the demographic groups most similar to Pueblo are Immigrants from Eastern Africa (5.7%, a difference of 0.010%), Marshallese (5.7%, a difference of 0.040%), Danish (5.7%, a difference of 0.060%), Immigrants from Bosnia and Herzegovina (5.7%, a difference of 0.070%), and Immigrants from Canada (5.7%, a difference of 0.090%).
| Demographics | Rating | Rank | Disability Age 5 to 17 |
| Mexican American Indians | 35.2 /100 | #182 | Fair 5.6% |
| Immigrants | Latin America | 34.3 /100 | #183 | Fair 5.6% |
| Syrians | 33.8 /100 | #184 | Fair 5.6% |
| Immigrants | Mexico | 33.7 /100 | #185 | Fair 5.6% |
| Fijians | 31.7 /100 | #186 | Fair 5.7% |
| Immigrants | Thailand | 30.2 /100 | #187 | Fair 5.7% |
| Marshallese | 28.1 /100 | #188 | Fair 5.7% |
| Pueblo | 27.5 /100 | #189 | Fair 5.7% |
| Immigrants | Eastern Africa | 27.3 /100 | #190 | Fair 5.7% |
| Danes | 26.5 /100 | #191 | Fair 5.7% |
| Immigrants | Bosnia and Herzegovina | 26.3 /100 | #192 | Fair 5.7% |
| Immigrants | Canada | 26.1 /100 | #193 | Fair 5.7% |
| Croatians | 23.6 /100 | #194 | Fair 5.7% |
| Immigrants | Nigeria | 23.4 /100 | #195 | Fair 5.7% |
| Inupiat | 23.3 /100 | #196 | Fair 5.7% |