Sudanese vs Immigrants from Ghana Male Disability
COMPARE
Sudanese
Immigrants from Ghana
Male Disability
Male Disability Comparison
Sudanese
Immigrants from Ghana
11.0%
MALE DISABILITY
77.1/ 100
METRIC RATING
148th/ 347
METRIC RANK
10.9%
MALE DISABILITY
89.0/ 100
METRIC RATING
122nd/ 347
METRIC RANK
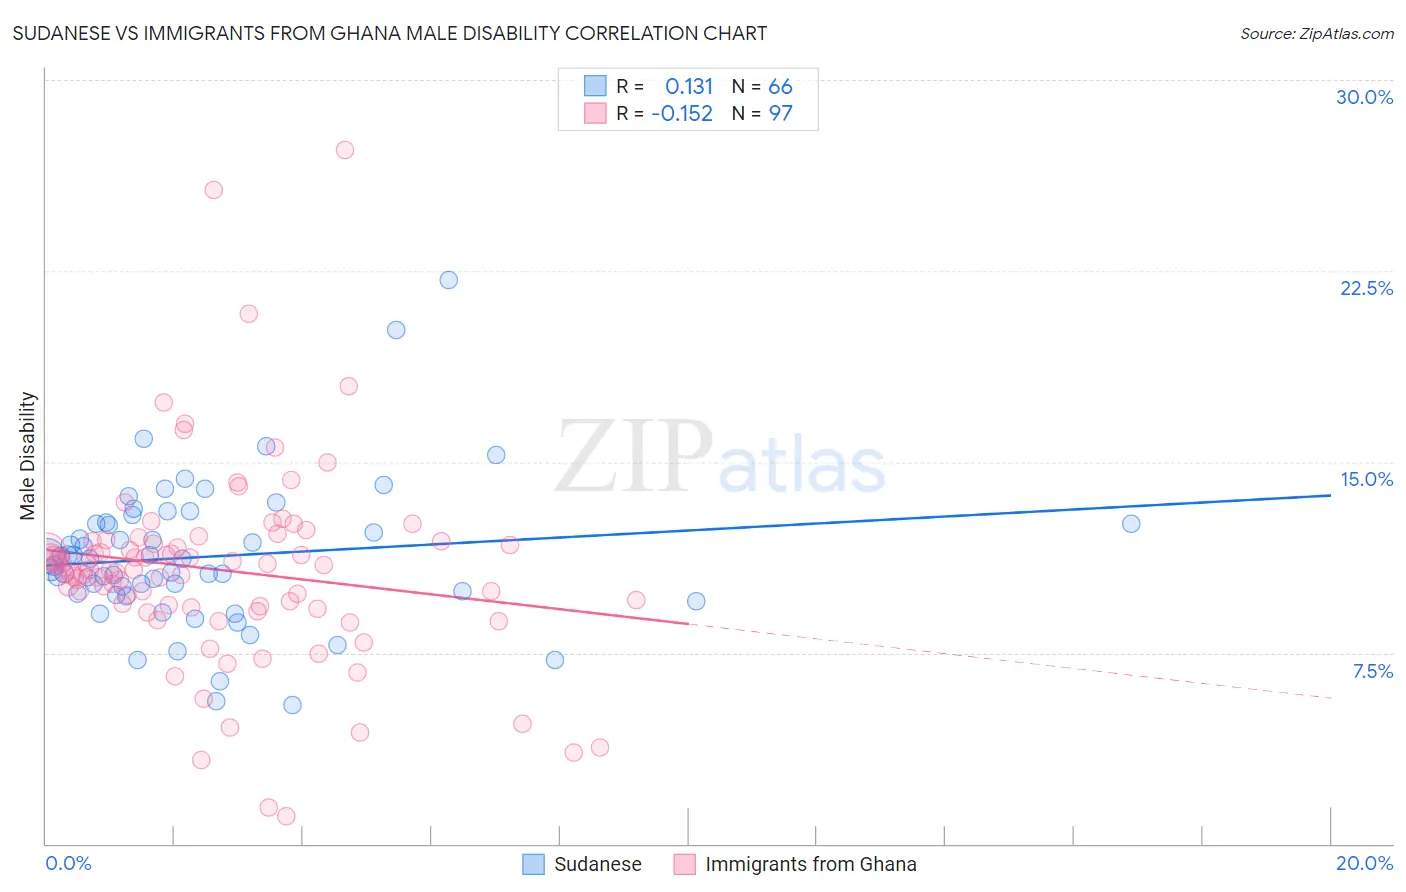
Sudanese vs Immigrants from Ghana Male Disability Correlation Chart
The statistical analysis conducted on geographies consisting of 110,141,954 people shows a poor positive correlation between the proportion of Sudanese and percentage of males with a disability in the United States with a correlation coefficient (R) of 0.131 and weighted average of 11.0%. Similarly, the statistical analysis conducted on geographies consisting of 199,919,905 people shows a poor negative correlation between the proportion of Immigrants from Ghana and percentage of males with a disability in the United States with a correlation coefficient (R) of -0.152 and weighted average of 10.9%, a difference of 1.3%.
Male Disability Correlation Summary
| Measurement | Sudanese | Immigrants from Ghana |
| Minimum | 5.5% | 1.1% |
| Maximum | 22.1% | 27.2% |
| Range | 16.7% | 26.2% |
| Mean | 11.3% | 10.8% |
| Median | 11.1% | 10.8% |
| Interquartile 25% (IQ1) | 9.8% | 9.3% |
| Interquartile 75% (IQ3) | 12.6% | 11.9% |
| Interquartile Range (IQR) | 2.7% | 2.6% |
| Standard Deviation (Sample) | 2.8% | 3.9% |
| Standard Deviation (Population) | 2.8% | 3.9% |
Similar Demographics by Male Disability
Demographics Similar to Sudanese by Male Disability
In terms of male disability, the demographic groups most similar to Sudanese are Immigrants from Croatia (11.0%, a difference of 0.010%), Korean (11.0%, a difference of 0.030%), Immigrants from Denmark (11.0%, a difference of 0.060%), Costa Rican (11.0%, a difference of 0.070%), and Kenyan (11.0%, a difference of 0.080%).
| Demographics | Rating | Rank | Male Disability |
| Arabs | 81.5 /100 | #141 | Excellent 11.0% |
| Immigrants | Sudan | 81.5 /100 | #142 | Excellent 11.0% |
| Moroccans | 80.7 /100 | #143 | Excellent 11.0% |
| Kenyans | 78.1 /100 | #144 | Good 11.0% |
| Costa Ricans | 78.0 /100 | #145 | Good 11.0% |
| Koreans | 77.5 /100 | #146 | Good 11.0% |
| Immigrants | Croatia | 77.3 /100 | #147 | Good 11.0% |
| Sudanese | 77.1 /100 | #148 | Good 11.0% |
| Immigrants | Denmark | 76.4 /100 | #149 | Good 11.0% |
| Immigrants | Guatemala | 75.1 /100 | #150 | Good 11.0% |
| Cubans | 74.9 /100 | #151 | Good 11.0% |
| Immigrants | Albania | 74.4 /100 | #152 | Good 11.0% |
| Immigrants | Northern Europe | 73.2 /100 | #153 | Good 11.1% |
| Immigrants | Moldova | 72.8 /100 | #154 | Good 11.1% |
| Immigrants | Middle Africa | 70.9 /100 | #155 | Good 11.1% |
Demographics Similar to Immigrants from Ghana by Male Disability
In terms of male disability, the demographic groups most similar to Immigrants from Ghana are Immigrants from South Eastern Asia (10.9%, a difference of 0.010%), Immigrants from Africa (10.9%, a difference of 0.060%), Immigrants from Czechoslovakia (10.9%, a difference of 0.090%), South American Indian (10.9%, a difference of 0.14%), and Immigrants from North Macedonia (10.9%, a difference of 0.14%).
| Demographics | Rating | Rank | Male Disability |
| Immigrants | Barbados | 92.2 /100 | #115 | Exceptional 10.8% |
| Immigrants | South Africa | 91.8 /100 | #116 | Exceptional 10.8% |
| Eastern Europeans | 90.6 /100 | #117 | Exceptional 10.9% |
| Immigrants | Cuba | 90.2 /100 | #118 | Exceptional 10.9% |
| Armenians | 90.1 /100 | #119 | Exceptional 10.9% |
| Immigrants | Africa | 89.4 /100 | #120 | Excellent 10.9% |
| Immigrants | South Eastern Asia | 89.2 /100 | #121 | Excellent 10.9% |
| Immigrants | Ghana | 89.0 /100 | #122 | Excellent 10.9% |
| Immigrants | Czechoslovakia | 88.4 /100 | #123 | Excellent 10.9% |
| South American Indians | 88.1 /100 | #124 | Excellent 10.9% |
| Immigrants | North Macedonia | 88.1 /100 | #125 | Excellent 10.9% |
| Immigrants | Trinidad and Tobago | 86.9 /100 | #126 | Excellent 10.9% |
| Immigrants | Ukraine | 86.8 /100 | #127 | Excellent 10.9% |
| Immigrants | Latvia | 85.5 /100 | #128 | Excellent 10.9% |
| Immigrants | Philippines | 85.4 /100 | #129 | Excellent 10.9% |