Pennsylvania German vs Scottish Disability Age Over 75

COMPARE

Pennsylvania German
Race
Ancestry
AfghanAfricanAlaska NativeAlaskan AthabascanAlbanianAleutAlsatianAmericanApacheArabArapahoArgentineanArmenianAssyrian/Chaldean/SyriacAustralianAustrianBahamianBangladeshiBarbadianBasqueBelgianBelizeanBermudanBhutaneseBlackfeetBolivianBrazilianBritishBritish West IndianBulgarianBurmeseCajunCambodianCanadianCape VerdeanCarpatho RusynCelticCentral AmericanCentral American IndianCherokeeCheyenneChickasawChileanChineseChippewaChoctawColombianColvilleComancheCosta RicanCreeCreekCroatianCrowCubanCypriotCzechCzechoslovakianDanishDelawareDominicanDutchDutch West IndianEastern EuropeanEcuadorianEgyptianEnglishEstonianEthiopianEuropeanFijianFilipinoFinnishFrenchFrench American IndianFrench CanadianGermanGerman RussianGhanaianGreekGuamanian/ChamorroGuatemalanGuyaneseHaitianHmongHonduranHopiHoumaHungarianIcelanderIndian (Asian)IndonesianInupiatIranianIraqiIrishIroquoisIsraeliItalianJamaicanJapaneseJordanianKenyanKiowaKoreanLaotianLatvianLebaneseLiberianLithuanianLumbeeLuxembourgerMacedonianMalaysianMalteseMarshalleseMenomineeMexicanMexican American IndianMongolianMoroccanNative HawaiianNavajoNepaleseNew ZealanderNicaraguanNigerianNorthern EuropeanNorwegianOkinawanOsageOttawaPaiutePakistaniPalestinianPanamanianParaguayanPennsylvania GermanPeruvianPimaPolishPortuguesePotawatomiPuebloPuerto RicanPuget Sound SalishRomanianRussianSalvadoranSamoanScandinavianScotch-IrishSeminoleSenegaleseSerbianShoshoneSierra LeoneanSiouxSlavicSlovakSloveneSomaliSouth AfricanSouth AmericanSouth American IndianSoviet UnionSpaniardSpanishSpanish AmericanSpanish American IndianSri LankanSubsaharan AfricanSudaneseSwedishSwissSyrianTaiwaneseThaiTlingit-HaidaTohono O'OdhamTonganTrinidadian and TobagonianTsimshianTurkishU.S. Virgin IslanderUgandanUkrainianUruguayanUteVenezuelanVietnameseWelshWest IndianYakamaYaquiYugoslavianYumanYup'ikZimbabwean
Immigration
NonimmigrantsImmigrantsAfghanistanAfricaAlbaniaArgentinaArmeniaAsiaAustraliaAustriaBahamasBangladeshBarbadosBelarusBelgiumBelizeBoliviaBosnia and HerzegovinaBrazilBulgariaBurma/MyanmarCabo VerdeCambodiaCameroonCanadaCaribbeanCentral AmericaChileChinaColombiaCongoCosta RicaCroatiaCubaCzechoslovakiaDenmarkDominicaDominican RepublicEastern AfricaEastern AsiaEastern EuropeEcuadorEgyptEl SalvadorEnglandEritreaEthiopiaEuropeFijiFranceGermanyGhanaGreeceGrenadaGuatemalaGuyanaHaitiHondurasHong KongHungaryIndiaIndonesiaIranIraqIrelandIsraelItalyJamaicaJapanJordanKazakhstanKenyaKoreaKuwaitLaosLatin AmericaLatviaLebanonLiberiaLithuaniaMalaysiaMexicoMicronesiaMiddle AfricaMoldovaMoroccoNepalNetherlandsNicaraguaNigeriaNorth AmericaNorth MacedoniaNorthern AfricaNorthern EuropeNorwayOceaniaPakistanPanamaPeruPhilippinesPolandPortugalRomaniaRussiaSaudi ArabiaScotlandSenegalSerbiaSierra LeoneSingaporeSomaliaSouth AfricaSouth AmericaSouth Central AsiaSouth Eastern AsiaSouthern EuropeSpainSri LankaSt. Vincent and the GrenadinesSudanSwedenSwitzerlandSyriaTaiwanThailandTrinidad and TobagoTurkeyUgandaUkraineUruguayUzbekistanVenezuelaVietnamWest IndiesWestern AfricaWestern AsiaWestern EuropeYemenZaireZimbabweAzores
Scottish
Race
Ancestry
AfghanAfricanAlaska NativeAlaskan AthabascanAlbanianAleutAlsatianAmericanApacheArabArapahoArgentineanArmenianAssyrian/Chaldean/SyriacAustralianAustrianBahamianBangladeshiBarbadianBasqueBelgianBelizeanBermudanBhutaneseBlackfeetBolivianBrazilianBritishBritish West IndianBulgarianBurmeseCajunCambodianCanadianCape VerdeanCarpatho RusynCelticCentral AmericanCentral American IndianCherokeeCheyenneChickasawChileanChineseChippewaChoctawColombianColvilleComancheCosta RicanCreeCreekCroatianCrowCubanCypriotCzechCzechoslovakianDanishDelawareDominicanDutchDutch West IndianEastern EuropeanEcuadorianEgyptianEnglishEstonianEthiopianEuropeanFijianFilipinoFinnishFrenchFrench American IndianFrench CanadianGermanGerman RussianGhanaianGreekGuamanian/ChamorroGuatemalanGuyaneseHaitianHmongHonduranHopiHoumaHungarianIcelanderIndian (Asian)IndonesianInupiatIranianIraqiIrishIroquoisIsraeliItalianJamaicanJapaneseJordanianKenyanKiowaKoreanLaotianLatvianLebaneseLiberianLithuanianLumbeeLuxembourgerMacedonianMalaysianMalteseMarshalleseMenomineeMexicanMexican American IndianMongolianMoroccanNative HawaiianNavajoNepaleseNew ZealanderNicaraguanNigerianNorthern EuropeanNorwegianOkinawanOsageOttawaPaiutePakistaniPalestinianPanamanianParaguayanPeruvianPimaPolishPortuguesePotawatomiPuebloPuerto RicanPuget Sound SalishRomanianRussianSalvadoranSamoanScandinavianScotch-IrishScottishSeminoleSenegaleseSerbianShoshoneSierra LeoneanSiouxSlavicSlovakSloveneSomaliSouth AfricanSouth AmericanSouth American IndianSoviet UnionSpaniardSpanishSpanish AmericanSpanish American IndianSri LankanSubsaharan AfricanSudaneseSwedishSwissSyrianTaiwaneseThaiTlingit-HaidaTohono O'OdhamTonganTrinidadian and TobagonianTsimshianTurkishU.S. Virgin IslanderUgandanUkrainianUruguayanUteVenezuelanVietnameseWelshWest IndianYakamaYaquiYugoslavianYumanYup'ikZimbabwean
Immigration
NonimmigrantsImmigrantsAfghanistanAfricaAlbaniaArgentinaArmeniaAsiaAustraliaAustriaBahamasBangladeshBarbadosBelarusBelgiumBelizeBoliviaBosnia and HerzegovinaBrazilBulgariaBurma/MyanmarCabo VerdeCambodiaCameroonCanadaCaribbeanCentral AmericaChileChinaColombiaCongoCosta RicaCroatiaCubaCzechoslovakiaDenmarkDominicaDominican RepublicEastern AfricaEastern AsiaEastern EuropeEcuadorEgyptEl SalvadorEnglandEritreaEthiopiaEuropeFijiFranceGermanyGhanaGreeceGrenadaGuatemalaGuyanaHaitiHondurasHong KongHungaryIndiaIndonesiaIranIraqIrelandIsraelItalyJamaicaJapanJordanKazakhstanKenyaKoreaKuwaitLaosLatin AmericaLatviaLebanonLiberiaLithuaniaMalaysiaMexicoMicronesiaMiddle AfricaMoldovaMoroccoNepalNetherlandsNicaraguaNigeriaNorth AmericaNorth MacedoniaNorthern AfricaNorthern EuropeNorwayOceaniaPakistanPanamaPeruPhilippinesPolandPortugalRomaniaRussiaSaudi ArabiaScotlandSenegalSerbiaSierra LeoneSingaporeSomaliaSouth AfricaSouth AmericaSouth Central AsiaSouth Eastern AsiaSouthern EuropeSpainSri LankaSt. Vincent and the GrenadinesSudanSwedenSwitzerlandSyriaTaiwanThailandTrinidad and TobagoTurkeyUgandaUkraineUruguayUzbekistanVenezuelaVietnamWest IndiesWestern AfricaWestern AsiaWestern EuropeYemenZaireZimbabweAzores
Disability Age Over 75
Income
Poverty
Unemployment
Labor Participation
Family Structure
Vehicle Availability
Education Level
Disability

Disability Age Over 75 Comparison

Pennsylvania Germans

Scottish

Good
Exceptional
47.2%
DISABILITY AGE OVER 75
66.0/ 100
METRIC RATING
162nd/ 347
METRIC RANK
46.7%
DISABILITY AGE OVER 75
90.5/ 100
METRIC RATING
131st/ 347
METRIC RANK

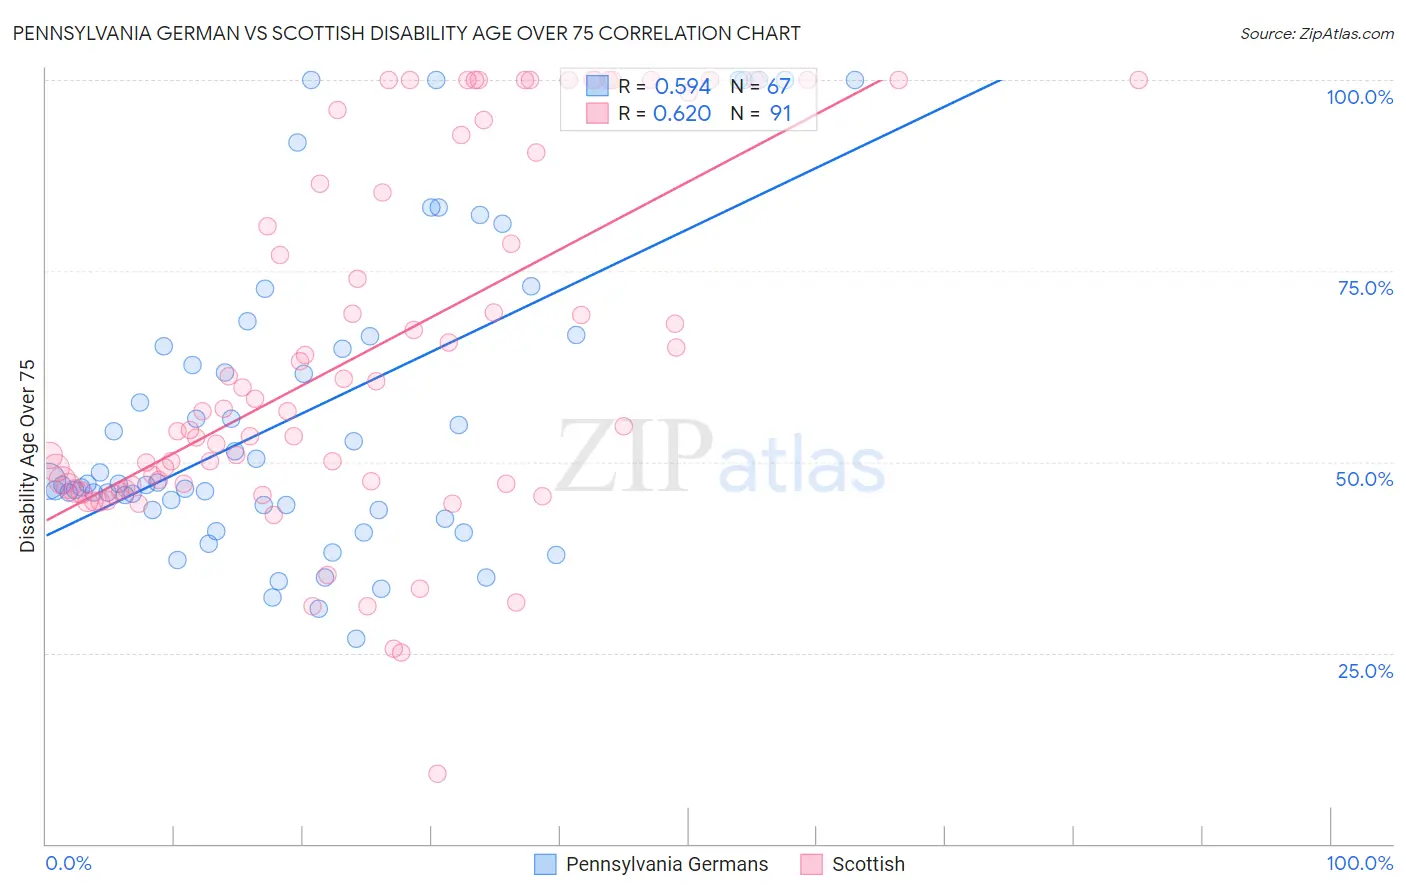
Pennsylvania German vs Scottish Disability Age Over 75 Correlation Chart

The statistical analysis conducted on geographies consisting of 233,972,902 people shows a substantial positive correlation between the proportion of Pennsylvania Germans and percentage of population with a disability over the age of 75 in the United States with a correlation coefficient (R) of 0.594 and weighted average of 47.2%. Similarly, the statistical analysis conducted on geographies consisting of 565,035,071 people shows a significant positive correlation between the proportion of Scottish and percentage of population with a disability over the age of 75 in the United States with a correlation coefficient (R) of 0.620 and weighted average of 46.7%, a difference of 0.90%.
Pennsylvania German vs Scottish Disability Age Over 75

Disability Age Over 75 Correlation Summary

MeasurementPennsylvania GermanScottish
Minimum26.8%9.1%
Maximum100.0%100.0%
Range73.2%90.9%
Mean56.4%64.1%
Median47.2%56.7%
Interquartile 25% (IQ1)43.8%46.8%
Interquartile 75% (IQ3)66.5%90.5%
Interquartile Range (IQR)22.8%43.6%
Standard Deviation (Sample)20.3%23.7%
Standard Deviation (Population)20.2%23.6%

Similar Demographics by Disability Age Over 75

Demographics Similar to Pennsylvania Germans by Disability Age Over 75

In terms of disability age over 75, the demographic groups most similar to Pennsylvania Germans are Immigrants from Eastern Africa (47.2%, a difference of 0.010%), French (47.2%, a difference of 0.030%), Immigrants from Zimbabwe (47.2%, a difference of 0.040%), Immigrants from Sierra Leone (47.2%, a difference of 0.040%), and South American Indian (47.1%, a difference of 0.050%).
DemographicsRating | RankDisability Age Over 75
Immigrants | Iran
74.7
/100
|
#155
Good
47.1%
Arabs
73.3
/100
|
#156
Good
47.1%
Bhutanese
72.6
/100
|
#157
Good
47.1%
Immigrants | Guyana
71.9
/100
|
#158
Good
47.1%
Immigrants | Morocco
71.4
/100
|
#159
Good
47.1%
Immigrants | Middle Africa
68.3
/100
|
#160
Good
47.1%
South American Indians
68.1
/100
|
#161
Good
47.1%
Pennsylvania Germans
66.0
/100
|
#162
Good
47.2%
Immigrants | Eastern Africa
65.5
/100
|
#163
Good
47.2%
French
64.6
/100
|
#164
Good
47.2%
Immigrants | Zimbabwe
64.4
/100
|
#165
Good
47.2%
Immigrants | Sierra Leone
64.4
/100
|
#166
Good
47.2%
Moroccans
62.9
/100
|
#167
Good
47.2%
Kenyans
58.8
/100
|
#168
Average
47.2%
Celtics
58.7
/100
|
#169
Average
47.2%

Demographics Similar to Scottish by Disability Age Over 75

In terms of disability age over 75, the demographic groups most similar to Scottish are Immigrants from Northern Africa (46.7%, a difference of 0.010%), Immigrants from Germany (46.7%, a difference of 0.020%), Icelander (46.7%, a difference of 0.030%), South American (46.8%, a difference of 0.030%), and Syrian (46.7%, a difference of 0.040%).
DemographicsRating | RankDisability Age Over 75
Immigrants | South America
91.8
/100
|
#124
Exceptional
46.7%
Colombians
91.3
/100
|
#125
Exceptional
46.7%
Europeans
91.2
/100
|
#126
Exceptional
46.7%
Syrians
91.1
/100
|
#127
Exceptional
46.7%
Icelanders
90.9
/100
|
#128
Exceptional
46.7%
Immigrants | Germany
90.8
/100
|
#129
Exceptional
46.7%
Immigrants | Northern Africa
90.7
/100
|
#130
Exceptional
46.7%
Scottish
90.5
/100
|
#131
Exceptional
46.7%
South Americans
90.0
/100
|
#132
Excellent
46.8%
English
89.4
/100
|
#133
Excellent
46.8%
Immigrants | Ethiopia
89.1
/100
|
#134
Excellent
46.8%
Ethiopians
88.9
/100
|
#135
Excellent
46.8%
Immigrants | Venezuela
88.6
/100
|
#136
Excellent
46.8%
Immigrants | Uganda
88.5
/100
|
#137
Excellent
46.8%
Immigrants | Bosnia and Herzegovina
88.5
/100
|
#138
Excellent
46.8%