Welsh vs Scottish Disability Age Over 75
COMPARE
Welsh
Scottish
Disability Age Over 75
Disability Age Over 75 Comparison
Welsh
Scottish
47.0%
DISABILITY AGE OVER 75
81.3/ 100
METRIC RATING
149th/ 347
METRIC RANK
46.7%
DISABILITY AGE OVER 75
90.5/ 100
METRIC RATING
131st/ 347
METRIC RANK
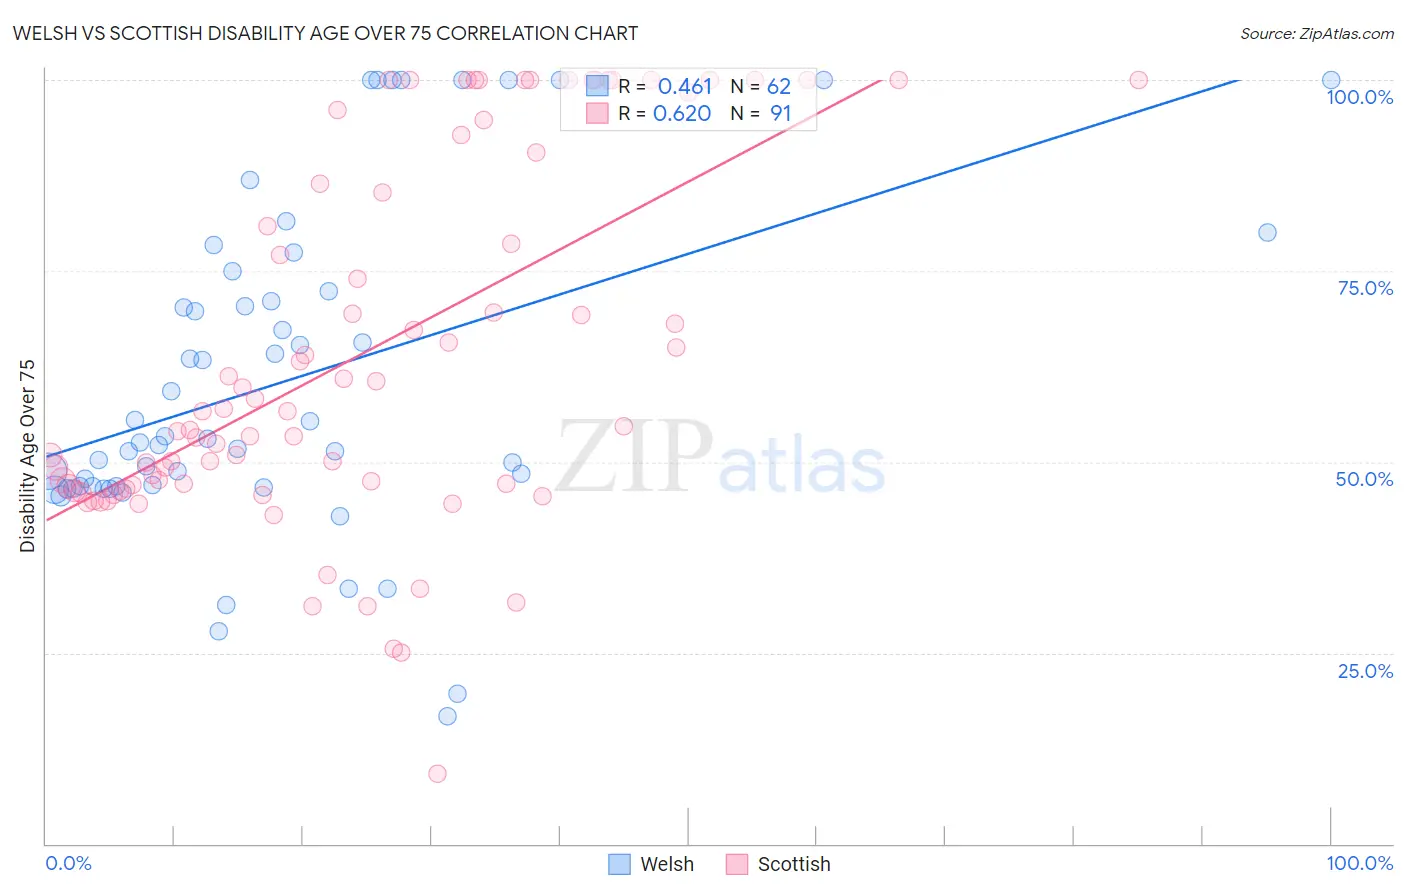
Welsh vs Scottish Disability Age Over 75 Correlation Chart
The statistical analysis conducted on geographies consisting of 527,126,487 people shows a moderate positive correlation between the proportion of Welsh and percentage of population with a disability over the age of 75 in the United States with a correlation coefficient (R) of 0.461 and weighted average of 47.0%. Similarly, the statistical analysis conducted on geographies consisting of 565,035,071 people shows a significant positive correlation between the proportion of Scottish and percentage of population with a disability over the age of 75 in the United States with a correlation coefficient (R) of 0.620 and weighted average of 46.7%, a difference of 0.44%.
Disability Age Over 75 Correlation Summary
| Measurement | Welsh | Scottish |
| Minimum | 16.7% | 9.1% |
| Maximum | 100.0% | 100.0% |
| Range | 83.3% | 90.9% |
| Mean | 60.7% | 64.1% |
| Median | 52.8% | 56.7% |
| Interquartile 25% (IQ1) | 46.8% | 46.8% |
| Interquartile 75% (IQ3) | 72.3% | 90.5% |
| Interquartile Range (IQR) | 25.5% | 43.6% |
| Standard Deviation (Sample) | 21.5% | 23.7% |
| Standard Deviation (Population) | 21.3% | 23.6% |
Demographics Similar to Welsh and Scottish by Disability Age Over 75
In terms of disability age over 75, the demographic groups most similar to Welsh are Asian (46.9%, a difference of 0.010%), Immigrants from Russia (47.0%, a difference of 0.070%), Immigrants from Peru (46.9%, a difference of 0.11%), Guyanese (46.9%, a difference of 0.12%), and Costa Rican (46.9%, a difference of 0.13%). Similarly, the demographic groups most similar to Scottish are Immigrants from Northern Africa (46.7%, a difference of 0.010%), South American (46.8%, a difference of 0.030%), English (46.8%, a difference of 0.070%), Immigrants from Ethiopia (46.8%, a difference of 0.090%), and Ethiopian (46.8%, a difference of 0.10%).
| Demographics | Rating | Rank | Disability Age Over 75 |
| Immigrants | Northern Africa | 90.7 /100 | #130 | Exceptional 46.7% |
| Scottish | 90.5 /100 | #131 | Exceptional 46.7% |
| South Americans | 90.0 /100 | #132 | Excellent 46.8% |
| English | 89.4 /100 | #133 | Excellent 46.8% |
| Immigrants | Ethiopia | 89.1 /100 | #134 | Excellent 46.8% |
| Ethiopians | 88.9 /100 | #135 | Excellent 46.8% |
| Immigrants | Venezuela | 88.6 /100 | #136 | Excellent 46.8% |
| Immigrants | Uganda | 88.5 /100 | #137 | Excellent 46.8% |
| Immigrants | Bosnia and Herzegovina | 88.5 /100 | #138 | Excellent 46.8% |
| Yugoslavians | 88.5 /100 | #139 | Excellent 46.8% |
| Immigrants | Costa Rica | 87.4 /100 | #140 | Excellent 46.8% |
| Lebanese | 87.0 /100 | #141 | Excellent 46.8% |
| Peruvians | 86.5 /100 | #142 | Excellent 46.8% |
| Bermudans | 85.6 /100 | #143 | Excellent 46.9% |
| Venezuelans | 85.0 /100 | #144 | Excellent 46.9% |
| Costa Ricans | 84.5 /100 | #145 | Excellent 46.9% |
| Guyanese | 84.3 /100 | #146 | Excellent 46.9% |
| Immigrants | Peru | 84.1 /100 | #147 | Excellent 46.9% |
| Asians | 81.6 /100 | #148 | Excellent 46.9% |
| Welsh | 81.3 /100 | #149 | Excellent 47.0% |
| Immigrants | Russia | 79.3 /100 | #150 | Good 47.0% |