Immigrants from China vs Scottish Disability Age Over 75
COMPARE
Immigrants from China
Scottish
Disability Age Over 75
Disability Age Over 75 Comparison
Immigrants from China
Scottish
46.3%
DISABILITY AGE OVER 75
98.0/ 100
METRIC RATING
96th/ 347
METRIC RANK
46.7%
DISABILITY AGE OVER 75
90.5/ 100
METRIC RATING
131st/ 347
METRIC RANK
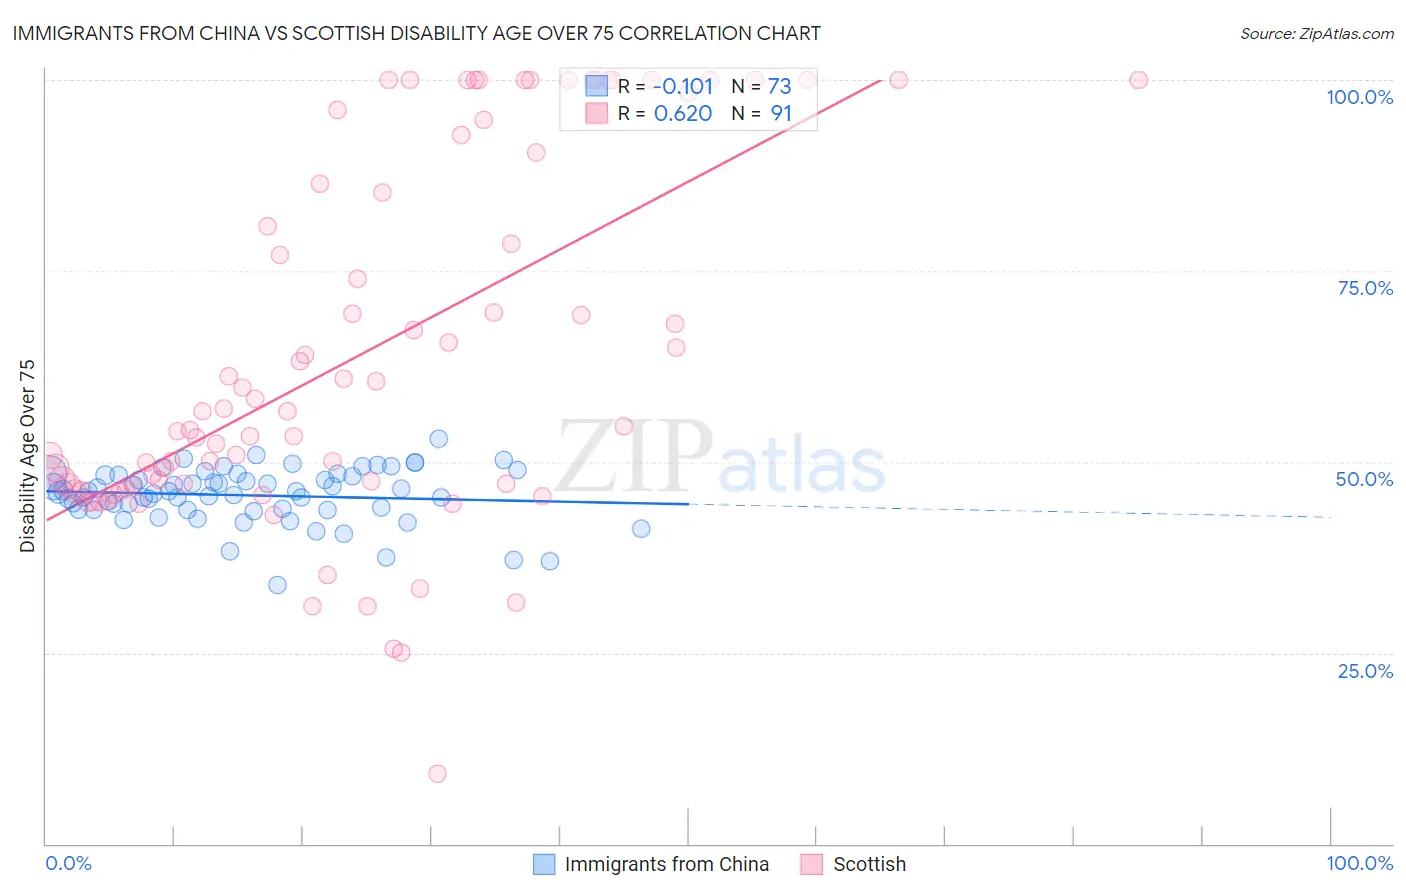
Immigrants from China vs Scottish Disability Age Over 75 Correlation Chart
The statistical analysis conducted on geographies consisting of 455,855,137 people shows a poor negative correlation between the proportion of Immigrants from China and percentage of population with a disability over the age of 75 in the United States with a correlation coefficient (R) of -0.101 and weighted average of 46.3%. Similarly, the statistical analysis conducted on geographies consisting of 565,035,071 people shows a significant positive correlation between the proportion of Scottish and percentage of population with a disability over the age of 75 in the United States with a correlation coefficient (R) of 0.620 and weighted average of 46.7%, a difference of 0.93%.
Disability Age Over 75 Correlation Summary
| Measurement | Immigrants from China | Scottish |
| Minimum | 33.8% | 9.1% |
| Maximum | 53.1% | 100.0% |
| Range | 19.3% | 90.9% |
| Mean | 45.6% | 64.1% |
| Median | 46.2% | 56.7% |
| Interquartile 25% (IQ1) | 43.8% | 46.8% |
| Interquartile 75% (IQ3) | 48.3% | 90.5% |
| Interquartile Range (IQR) | 4.5% | 43.6% |
| Standard Deviation (Sample) | 3.6% | 23.7% |
| Standard Deviation (Population) | 3.5% | 23.6% |
Similar Demographics by Disability Age Over 75
Demographics Similar to Immigrants from China by Disability Age Over 75
In terms of disability age over 75, the demographic groups most similar to Immigrants from China are Immigrants from Brazil (46.3%, a difference of 0.010%), Finnish (46.3%, a difference of 0.020%), Albanian (46.3%, a difference of 0.030%), Immigrants from Japan (46.3%, a difference of 0.030%), and Ugandan (46.3%, a difference of 0.060%).
| Demographics | Rating | Rank | Disability Age Over 75 |
| Immigrants | Saudi Arabia | 98.4 /100 | #89 | Exceptional 46.3% |
| Northern Europeans | 98.3 /100 | #90 | Exceptional 46.3% |
| Immigrants | Egypt | 98.3 /100 | #91 | Exceptional 46.3% |
| Germans | 98.2 /100 | #92 | Exceptional 46.3% |
| Ugandans | 98.2 /100 | #93 | Exceptional 46.3% |
| Albanians | 98.1 /100 | #94 | Exceptional 46.3% |
| Immigrants | Brazil | 98.0 /100 | #95 | Exceptional 46.3% |
| Immigrants | China | 98.0 /100 | #96 | Exceptional 46.3% |
| Finns | 97.9 /100 | #97 | Exceptional 46.3% |
| Immigrants | Japan | 97.8 /100 | #98 | Exceptional 46.3% |
| Palestinians | 97.7 /100 | #99 | Exceptional 46.3% |
| Immigrants | Eastern Europe | 97.7 /100 | #100 | Exceptional 46.3% |
| Mongolians | 97.7 /100 | #101 | Exceptional 46.3% |
| Immigrants | Malaysia | 97.1 /100 | #102 | Exceptional 46.4% |
| Ukrainians | 97.1 /100 | #103 | Exceptional 46.4% |
Demographics Similar to Scottish by Disability Age Over 75
In terms of disability age over 75, the demographic groups most similar to Scottish are Immigrants from Northern Africa (46.7%, a difference of 0.010%), Immigrants from Germany (46.7%, a difference of 0.020%), Icelander (46.7%, a difference of 0.030%), South American (46.8%, a difference of 0.030%), and Syrian (46.7%, a difference of 0.040%).
| Demographics | Rating | Rank | Disability Age Over 75 |
| Immigrants | South America | 91.8 /100 | #124 | Exceptional 46.7% |
| Colombians | 91.3 /100 | #125 | Exceptional 46.7% |
| Europeans | 91.2 /100 | #126 | Exceptional 46.7% |
| Syrians | 91.1 /100 | #127 | Exceptional 46.7% |
| Icelanders | 90.9 /100 | #128 | Exceptional 46.7% |
| Immigrants | Germany | 90.8 /100 | #129 | Exceptional 46.7% |
| Immigrants | Northern Africa | 90.7 /100 | #130 | Exceptional 46.7% |
| Scottish | 90.5 /100 | #131 | Exceptional 46.7% |
| South Americans | 90.0 /100 | #132 | Excellent 46.8% |
| English | 89.4 /100 | #133 | Excellent 46.8% |
| Immigrants | Ethiopia | 89.1 /100 | #134 | Excellent 46.8% |
| Ethiopians | 88.9 /100 | #135 | Excellent 46.8% |
| Immigrants | Venezuela | 88.6 /100 | #136 | Excellent 46.8% |
| Immigrants | Uganda | 88.5 /100 | #137 | Excellent 46.8% |
| Immigrants | Bosnia and Herzegovina | 88.5 /100 | #138 | Excellent 46.8% |