Portuguese vs Immigrants from Austria Disability Age Over 75
COMPARE
Portuguese
Immigrants from Austria
Disability Age Over 75
Disability Age Over 75 Comparison
Portuguese
Immigrants from Austria
47.6%
DISABILITY AGE OVER 75
29.3/ 100
METRIC RATING
191st/ 347
METRIC RANK
44.9%
DISABILITY AGE OVER 75
100.0/ 100
METRIC RATING
8th/ 347
METRIC RANK
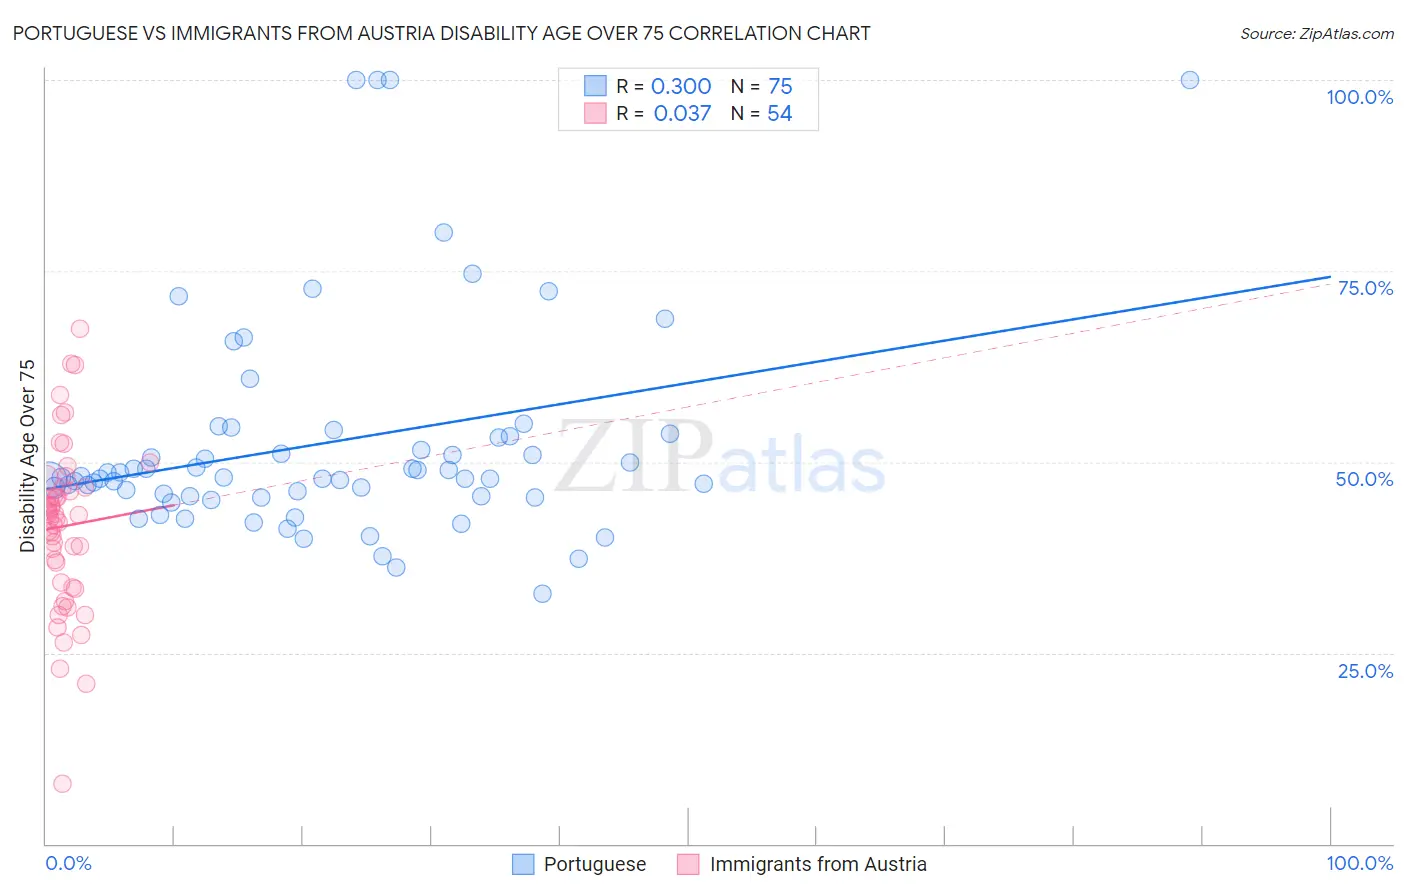
Portuguese vs Immigrants from Austria Disability Age Over 75 Correlation Chart
The statistical analysis conducted on geographies consisting of 449,198,171 people shows a mild positive correlation between the proportion of Portuguese and percentage of population with a disability over the age of 75 in the United States with a correlation coefficient (R) of 0.300 and weighted average of 47.6%. Similarly, the statistical analysis conducted on geographies consisting of 167,936,864 people shows no correlation between the proportion of Immigrants from Austria and percentage of population with a disability over the age of 75 in the United States with a correlation coefficient (R) of 0.037 and weighted average of 44.9%, a difference of 5.9%.
Disability Age Over 75 Correlation Summary
| Measurement | Portuguese | Immigrants from Austria |
| Minimum | 32.8% | 7.8% |
| Maximum | 100.0% | 67.5% |
| Range | 67.2% | 59.7% |
| Mean | 52.5% | 41.6% |
| Median | 47.9% | 42.8% |
| Interquartile 25% (IQ1) | 45.5% | 34.2% |
| Interquartile 75% (IQ3) | 53.3% | 46.7% |
| Interquartile Range (IQR) | 7.8% | 12.5% |
| Standard Deviation (Sample) | 14.5% | 10.9% |
| Standard Deviation (Population) | 14.4% | 10.8% |
Similar Demographics by Disability Age Over 75
Demographics Similar to Portuguese by Disability Age Over 75
In terms of disability age over 75, the demographic groups most similar to Portuguese are Somali (47.6%, a difference of 0.010%), Immigrants from Jamaica (47.6%, a difference of 0.030%), Ottawa (47.6%, a difference of 0.030%), Basque (47.6%, a difference of 0.040%), and Immigrants from Kenya (47.6%, a difference of 0.040%).
| Demographics | Rating | Rank | Disability Age Over 75 |
| Immigrants | Nigeria | 34.0 /100 | #184 | Fair 47.5% |
| Ghanaians | 33.0 /100 | #185 | Fair 47.5% |
| Sudanese | 32.0 /100 | #186 | Fair 47.5% |
| Immigrants | Sudan | 31.8 /100 | #187 | Fair 47.5% |
| Basques | 30.9 /100 | #188 | Fair 47.6% |
| Immigrants | Kenya | 30.8 /100 | #189 | Fair 47.6% |
| Somalis | 29.5 /100 | #190 | Fair 47.6% |
| Portuguese | 29.3 /100 | #191 | Fair 47.6% |
| Immigrants | Jamaica | 28.3 /100 | #192 | Fair 47.6% |
| Ottawa | 28.1 /100 | #193 | Fair 47.6% |
| Immigrants | Lebanon | 26.5 /100 | #194 | Fair 47.6% |
| Immigrants | Trinidad and Tobago | 25.3 /100 | #195 | Fair 47.6% |
| Immigrants | Portugal | 23.8 /100 | #196 | Fair 47.6% |
| Pakistanis | 23.4 /100 | #197 | Fair 47.7% |
| Immigrants | Ukraine | 23.2 /100 | #198 | Fair 47.7% |
Demographics Similar to Immigrants from Austria by Disability Age Over 75
In terms of disability age over 75, the demographic groups most similar to Immigrants from Austria are Paraguayan (45.0%, a difference of 0.080%), Okinawan (44.9%, a difference of 0.12%), Immigrants from Lithuania (44.9%, a difference of 0.16%), Bulgarian (45.1%, a difference of 0.24%), and Luxembourger (44.8%, a difference of 0.25%).
| Demographics | Rating | Rank | Disability Age Over 75 |
| Cypriots | 100.0 /100 | #1 | Exceptional 43.5% |
| Immigrants | Ireland | 100.0 /100 | #2 | Exceptional 44.7% |
| Eastern Europeans | 100.0 /100 | #3 | Exceptional 44.8% |
| Carpatho Rusyns | 100.0 /100 | #4 | Exceptional 44.8% |
| Luxembourgers | 100.0 /100 | #5 | Exceptional 44.8% |
| Immigrants | Lithuania | 100.0 /100 | #6 | Exceptional 44.9% |
| Okinawans | 100.0 /100 | #7 | Exceptional 44.9% |
| Immigrants | Austria | 100.0 /100 | #8 | Exceptional 44.9% |
| Paraguayans | 100.0 /100 | #9 | Exceptional 45.0% |
| Bulgarians | 100.0 /100 | #10 | Exceptional 45.1% |
| Lithuanians | 100.0 /100 | #11 | Exceptional 45.1% |
| Immigrants | Czechoslovakia | 100.0 /100 | #12 | Exceptional 45.1% |
| Latvians | 100.0 /100 | #13 | Exceptional 45.1% |
| Immigrants | Scotland | 100.0 /100 | #14 | Exceptional 45.1% |
| Immigrants | Sweden | 100.0 /100 | #15 | Exceptional 45.1% |