Seminole vs Immigrants from Austria Disability Age Over 75
COMPARE
Seminole
Immigrants from Austria
Disability Age Over 75
Disability Age Over 75 Comparison
Seminole
Immigrants from Austria
51.5%
DISABILITY AGE OVER 75
0.0/ 100
METRIC RATING
318th/ 347
METRIC RANK
44.9%
DISABILITY AGE OVER 75
100.0/ 100
METRIC RATING
8th/ 347
METRIC RANK
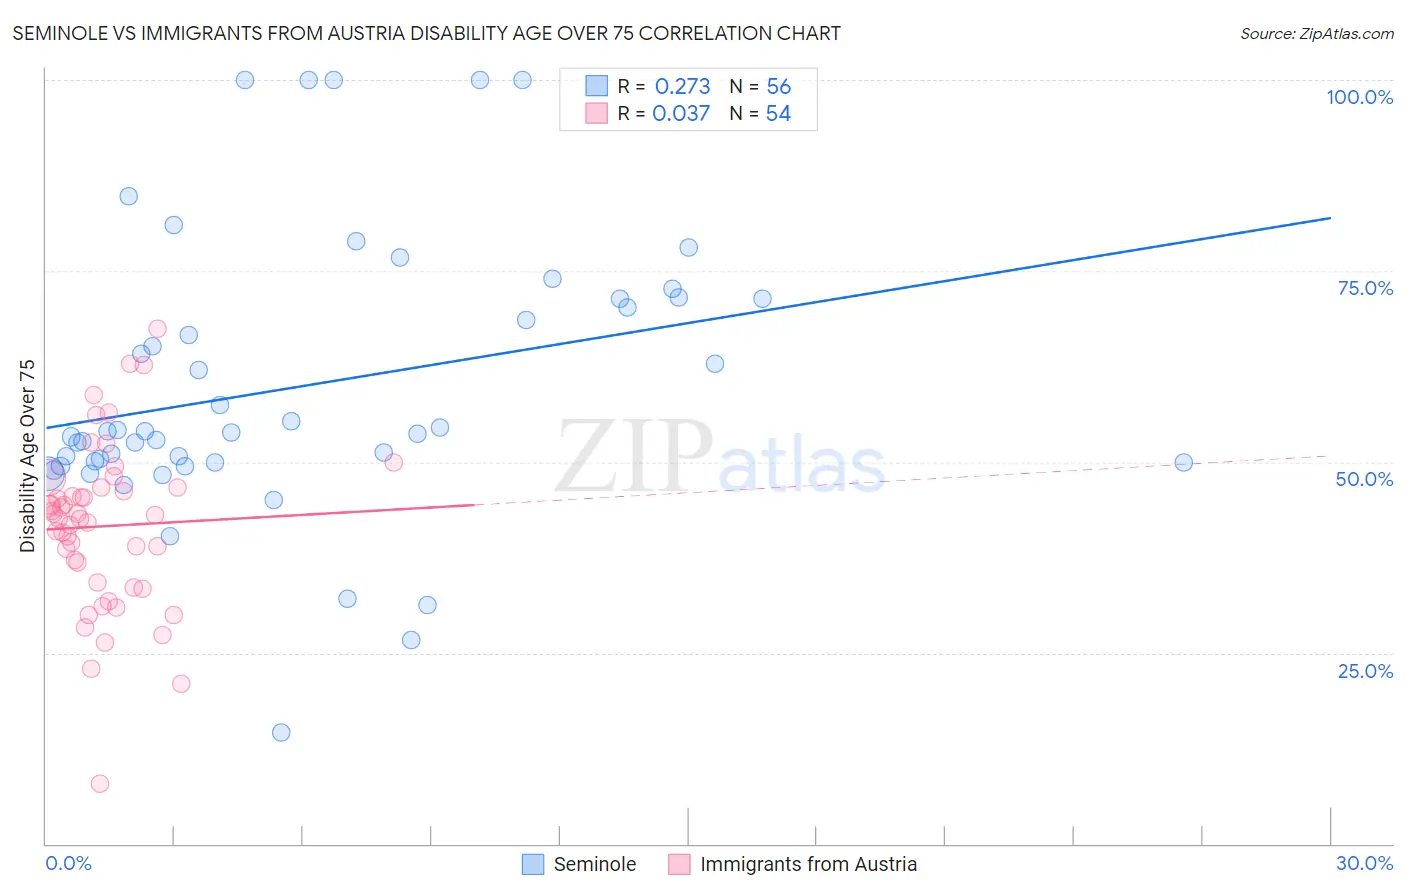
Seminole vs Immigrants from Austria Disability Age Over 75 Correlation Chart
The statistical analysis conducted on geographies consisting of 118,267,325 people shows a weak positive correlation between the proportion of Seminole and percentage of population with a disability over the age of 75 in the United States with a correlation coefficient (R) of 0.273 and weighted average of 51.5%. Similarly, the statistical analysis conducted on geographies consisting of 167,936,864 people shows no correlation between the proportion of Immigrants from Austria and percentage of population with a disability over the age of 75 in the United States with a correlation coefficient (R) of 0.037 and weighted average of 44.9%, a difference of 14.5%.
Disability Age Over 75 Correlation Summary
| Measurement | Seminole | Immigrants from Austria |
| Minimum | 14.6% | 7.8% |
| Maximum | 100.0% | 67.5% |
| Range | 85.4% | 59.7% |
| Mean | 59.9% | 41.6% |
| Median | 53.9% | 42.8% |
| Interquartile 25% (IQ1) | 50.0% | 34.2% |
| Interquartile 75% (IQ3) | 71.4% | 46.7% |
| Interquartile Range (IQR) | 21.4% | 12.5% |
| Standard Deviation (Sample) | 18.4% | 10.9% |
| Standard Deviation (Population) | 18.2% | 10.8% |
Similar Demographics by Disability Age Over 75
Demographics Similar to Seminole by Disability Age Over 75
In terms of disability age over 75, the demographic groups most similar to Seminole are Creek (51.5%, a difference of 0.0%), Paiute (51.5%, a difference of 0.14%), Dutch West Indian (51.5%, a difference of 0.15%), Yakama (51.3%, a difference of 0.33%), and Comanche (51.7%, a difference of 0.49%).
| Demographics | Rating | Rank | Disability Age Over 75 |
| Cajuns | 0.0 /100 | #311 | Tragic 50.7% |
| Cheyenne | 0.0 /100 | #312 | Tragic 50.9% |
| Immigrants | Azores | 0.0 /100 | #313 | Tragic 50.9% |
| Immigrants | Mexico | 0.0 /100 | #314 | Tragic 51.1% |
| Mexicans | 0.0 /100 | #315 | Tragic 51.1% |
| Chickasaw | 0.0 /100 | #316 | Tragic 51.2% |
| Yakama | 0.0 /100 | #317 | Tragic 51.3% |
| Seminole | 0.0 /100 | #318 | Tragic 51.5% |
| Creek | 0.0 /100 | #319 | Tragic 51.5% |
| Paiute | 0.0 /100 | #320 | Tragic 51.5% |
| Dutch West Indians | 0.0 /100 | #321 | Tragic 51.5% |
| Comanche | 0.0 /100 | #322 | Tragic 51.7% |
| Immigrants | Yemen | 0.0 /100 | #323 | Tragic 52.0% |
| Menominee | 0.0 /100 | #324 | Tragic 52.3% |
| Immigrants | Cabo Verde | 0.0 /100 | #325 | Tragic 52.4% |
Demographics Similar to Immigrants from Austria by Disability Age Over 75
In terms of disability age over 75, the demographic groups most similar to Immigrants from Austria are Paraguayan (45.0%, a difference of 0.080%), Okinawan (44.9%, a difference of 0.12%), Immigrants from Lithuania (44.9%, a difference of 0.16%), Bulgarian (45.1%, a difference of 0.24%), and Luxembourger (44.8%, a difference of 0.25%).
| Demographics | Rating | Rank | Disability Age Over 75 |
| Cypriots | 100.0 /100 | #1 | Exceptional 43.5% |
| Immigrants | Ireland | 100.0 /100 | #2 | Exceptional 44.7% |
| Eastern Europeans | 100.0 /100 | #3 | Exceptional 44.8% |
| Carpatho Rusyns | 100.0 /100 | #4 | Exceptional 44.8% |
| Luxembourgers | 100.0 /100 | #5 | Exceptional 44.8% |
| Immigrants | Lithuania | 100.0 /100 | #6 | Exceptional 44.9% |
| Okinawans | 100.0 /100 | #7 | Exceptional 44.9% |
| Immigrants | Austria | 100.0 /100 | #8 | Exceptional 44.9% |
| Paraguayans | 100.0 /100 | #9 | Exceptional 45.0% |
| Bulgarians | 100.0 /100 | #10 | Exceptional 45.1% |
| Lithuanians | 100.0 /100 | #11 | Exceptional 45.1% |
| Immigrants | Czechoslovakia | 100.0 /100 | #12 | Exceptional 45.1% |
| Latvians | 100.0 /100 | #13 | Exceptional 45.1% |
| Immigrants | Scotland | 100.0 /100 | #14 | Exceptional 45.1% |
| Immigrants | Sweden | 100.0 /100 | #15 | Exceptional 45.1% |