Subsaharan African vs Immigrants from Austria Median Family Income
COMPARE
Subsaharan African
Immigrants from Austria
Median Family Income
Median Family Income Comparison
Sub-Saharan Africans
Immigrants from Austria
$93,748
MEDIAN FAMILY INCOME
1.0/ 100
METRIC RATING
244th/ 347
METRIC RANK
$116,830
MEDIAN FAMILY INCOME
99.9/ 100
METRIC RATING
47th/ 347
METRIC RANK
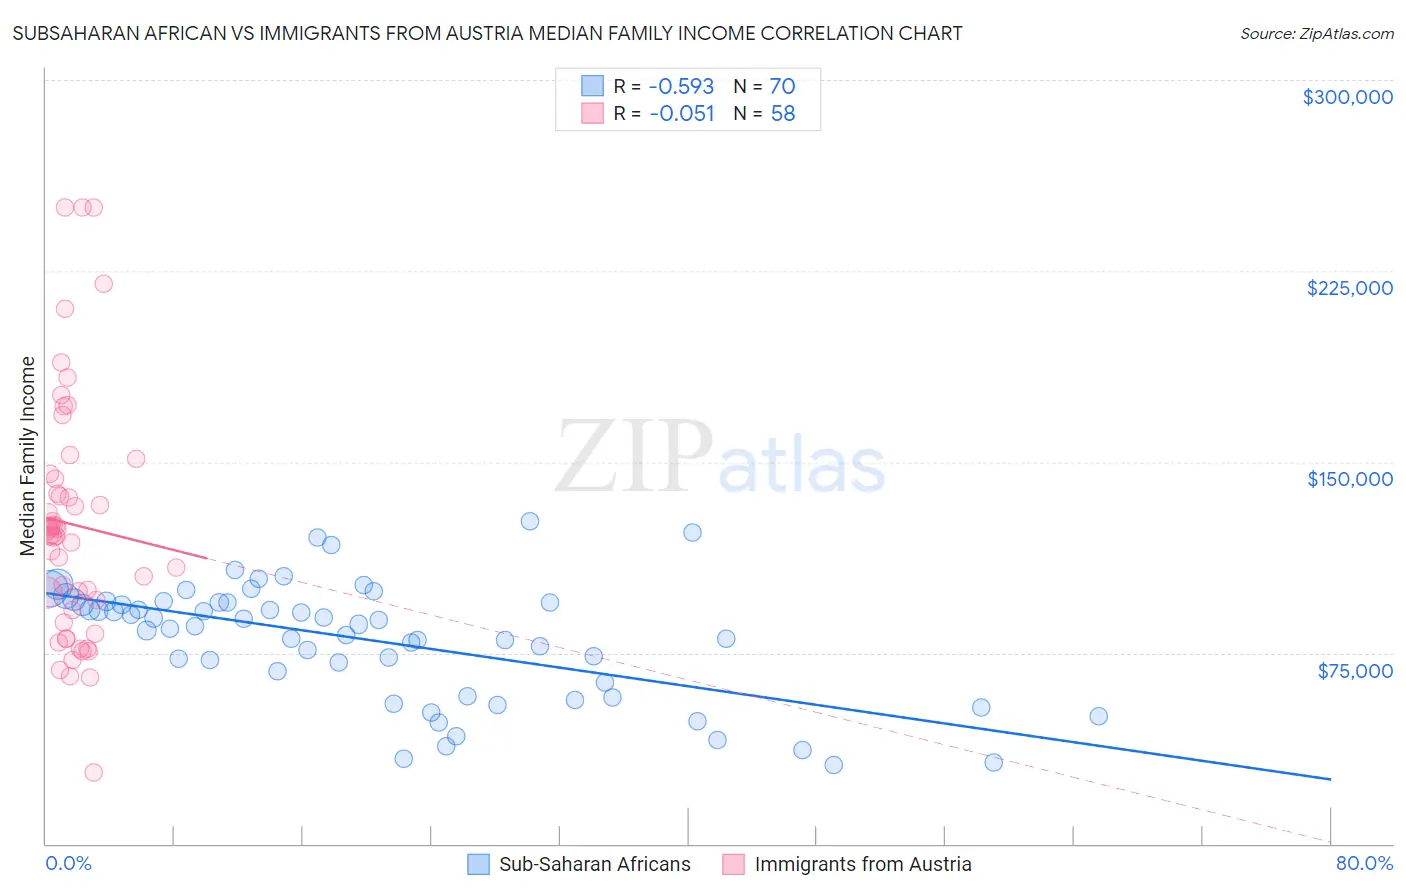
Subsaharan African vs Immigrants from Austria Median Family Income Correlation Chart
The statistical analysis conducted on geographies consisting of 507,233,451 people shows a substantial negative correlation between the proportion of Sub-Saharan Africans and median family income in the United States with a correlation coefficient (R) of -0.593 and weighted average of $93,748. Similarly, the statistical analysis conducted on geographies consisting of 167,957,927 people shows a slight negative correlation between the proportion of Immigrants from Austria and median family income in the United States with a correlation coefficient (R) of -0.051 and weighted average of $116,830, a difference of 24.6%.
Median Family Income Correlation Summary
| Measurement | Subsaharan African | Immigrants from Austria |
| Minimum | $31,084 | $28,077 |
| Maximum | $126,507 | $250,001 |
| Range | $95,423 | $221,924 |
| Mean | $80,060 | $125,494 |
| Median | $85,890 | $122,176 |
| Interquartile 25% (IQ1) | $63,281 | $91,605 |
| Interquartile 75% (IQ3) | $94,886 | $143,362 |
| Interquartile Range (IQR) | $31,605 | $51,756 |
| Standard Deviation (Sample) | $22,942 | $47,633 |
| Standard Deviation (Population) | $22,778 | $47,221 |
Similar Demographics by Median Family Income
Demographics Similar to Sub-Saharan Africans by Median Family Income
In terms of median family income, the demographic groups most similar to Sub-Saharan Africans are German Russian ($93,858, a difference of 0.12%), Immigrants from Middle Africa ($93,593, a difference of 0.17%), Barbadian ($93,919, a difference of 0.18%), Immigrants from Trinidad and Tobago ($93,988, a difference of 0.26%), and Somali ($94,085, a difference of 0.36%).
| Demographics | Rating | Rank | Median Family Income |
| Alaskan Athabascans | 1.5 /100 | #237 | Tragic $94,429 |
| Nepalese | 1.3 /100 | #238 | Tragic $94,153 |
| Salvadorans | 1.2 /100 | #239 | Tragic $94,109 |
| Somalis | 1.2 /100 | #240 | Tragic $94,085 |
| Immigrants | Trinidad and Tobago | 1.2 /100 | #241 | Tragic $93,988 |
| Barbadians | 1.1 /100 | #242 | Tragic $93,919 |
| German Russians | 1.1 /100 | #243 | Tragic $93,858 |
| Sub-Saharan Africans | 1.0 /100 | #244 | Tragic $93,748 |
| Immigrants | Middle Africa | 1.0 /100 | #245 | Tragic $93,593 |
| Guyanese | 0.9 /100 | #246 | Tragic $93,373 |
| Immigrants | Senegal | 0.7 /100 | #247 | Tragic $92,912 |
| French American Indians | 0.7 /100 | #248 | Tragic $92,872 |
| Immigrants | Ecuador | 0.7 /100 | #249 | Tragic $92,837 |
| West Indians | 0.6 /100 | #250 | Tragic $92,765 |
| Immigrants | Somalia | 0.6 /100 | #251 | Tragic $92,609 |
Demographics Similar to Immigrants from Austria by Median Family Income
In terms of median family income, the demographic groups most similar to Immigrants from Austria are Immigrants from Russia ($116,942, a difference of 0.10%), Immigrants from Greece ($117,344, a difference of 0.44%), Immigrants from South Africa ($116,286, a difference of 0.47%), Chinese ($116,188, a difference of 0.55%), and Immigrants from Czechoslovakia ($116,165, a difference of 0.57%).
| Demographics | Rating | Rank | Median Family Income |
| Immigrants | Lithuania | 100.0 /100 | #40 | Exceptional $118,053 |
| Estonians | 100.0 /100 | #41 | Exceptional $118,013 |
| Immigrants | Bolivia | 100.0 /100 | #42 | Exceptional $117,912 |
| Bulgarians | 100.0 /100 | #43 | Exceptional $117,818 |
| Cambodians | 100.0 /100 | #44 | Exceptional $117,780 |
| Immigrants | Greece | 99.9 /100 | #45 | Exceptional $117,344 |
| Immigrants | Russia | 99.9 /100 | #46 | Exceptional $116,942 |
| Immigrants | Austria | 99.9 /100 | #47 | Exceptional $116,830 |
| Immigrants | South Africa | 99.9 /100 | #48 | Exceptional $116,286 |
| Chinese | 99.9 /100 | #49 | Exceptional $116,188 |
| Immigrants | Czechoslovakia | 99.9 /100 | #50 | Exceptional $116,165 |
| Immigrants | Malaysia | 99.9 /100 | #51 | Exceptional $115,880 |
| Maltese | 99.9 /100 | #52 | Exceptional $115,862 |
| Immigrants | Norway | 99.9 /100 | #53 | Exceptional $115,847 |
| Immigrants | Europe | 99.9 /100 | #54 | Exceptional $115,523 |