Spanish vs Pennsylvania German Female Disability
COMPARE
Spanish
Pennsylvania German
Female Disability
Female Disability Comparison
Spanish
Pennsylvania Germans
13.0%
FEMALE DISABILITY
0.1/ 100
METRIC RATING
277th/ 347
METRIC RANK
13.4%
FEMALE DISABILITY
0.0/ 100
METRIC RATING
300th/ 347
METRIC RANK
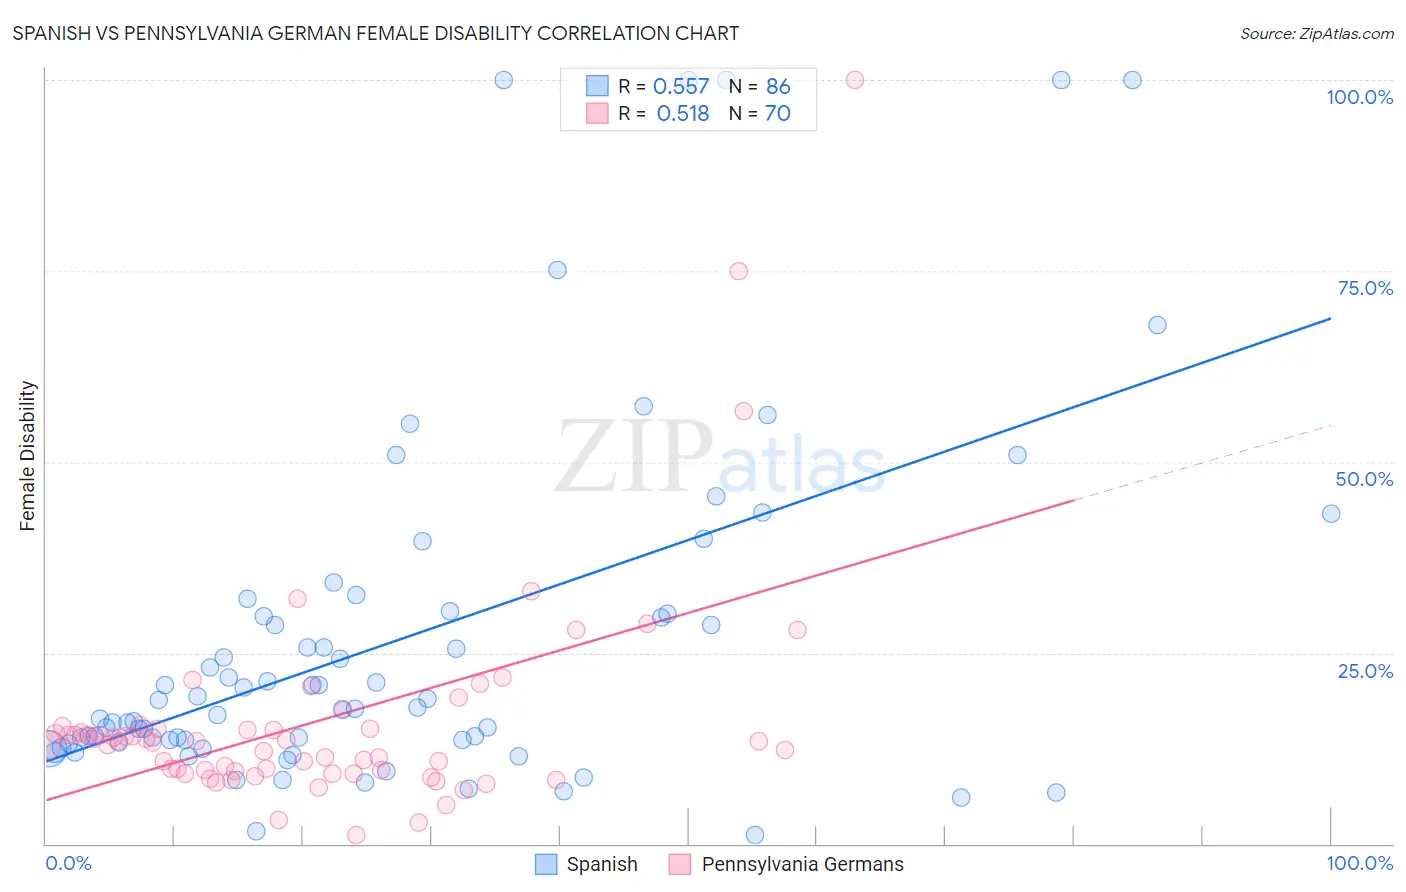
Spanish vs Pennsylvania German Female Disability Correlation Chart
The statistical analysis conducted on geographies consisting of 422,090,479 people shows a substantial positive correlation between the proportion of Spanish and percentage of females with a disability in the United States with a correlation coefficient (R) of 0.557 and weighted average of 13.0%. Similarly, the statistical analysis conducted on geographies consisting of 234,097,367 people shows a substantial positive correlation between the proportion of Pennsylvania Germans and percentage of females with a disability in the United States with a correlation coefficient (R) of 0.518 and weighted average of 13.4%, a difference of 3.1%.
Female Disability Correlation Summary
| Measurement | Spanish | Pennsylvania German |
| Minimum | 1.1% | 1.2% |
| Maximum | 100.0% | 100.0% |
| Range | 98.9% | 98.8% |
| Mean | 26.7% | 16.0% |
| Median | 17.7% | 13.3% |
| Interquartile 25% (IQ1) | 13.3% | 9.4% |
| Interquartile 75% (IQ3) | 30.0% | 15.1% |
| Interquartile Range (IQR) | 16.8% | 5.6% |
| Standard Deviation (Sample) | 23.4% | 14.9% |
| Standard Deviation (Population) | 23.2% | 14.8% |
Similar Demographics by Female Disability
Demographics Similar to Spanish by Female Disability
In terms of female disability, the demographic groups most similar to Spanish are Scottish (13.0%, a difference of 0.080%), Immigrants from Dominica (13.0%, a difference of 0.20%), Cheyenne (13.0%, a difference of 0.25%), Portuguese (13.0%, a difference of 0.31%), and Arapaho (13.0%, a difference of 0.33%).
| Demographics | Rating | Rank | Female Disability |
| Immigrants | Liberia | 0.3 /100 | #270 | Tragic 12.9% |
| Dutch | 0.2 /100 | #271 | Tragic 12.9% |
| Germans | 0.1 /100 | #272 | Tragic 12.9% |
| Sioux | 0.1 /100 | #273 | Tragic 12.9% |
| Portuguese | 0.1 /100 | #274 | Tragic 13.0% |
| Cheyenne | 0.1 /100 | #275 | Tragic 13.0% |
| Immigrants | Dominica | 0.1 /100 | #276 | Tragic 13.0% |
| Spanish | 0.1 /100 | #277 | Tragic 13.0% |
| Scottish | 0.1 /100 | #278 | Tragic 13.0% |
| Arapaho | 0.1 /100 | #279 | Tragic 13.0% |
| Irish | 0.1 /100 | #280 | Tragic 13.1% |
| U.S. Virgin Islanders | 0.1 /100 | #281 | Tragic 13.1% |
| Welsh | 0.0 /100 | #282 | Tragic 13.1% |
| English | 0.0 /100 | #283 | Tragic 13.1% |
| Hmong | 0.0 /100 | #284 | Tragic 13.1% |
Demographics Similar to Pennsylvania Germans by Female Disability
In terms of female disability, the demographic groups most similar to Pennsylvania Germans are Immigrants from Dominican Republic (13.4%, a difference of 0.010%), African (13.4%, a difference of 0.20%), Nonimmigrants (13.4%, a difference of 0.27%), Scotch-Irish (13.4%, a difference of 0.34%), and Immigrants from Portugal (13.5%, a difference of 0.34%).
| Demographics | Rating | Rank | Female Disability |
| Marshallese | 0.0 /100 | #293 | Tragic 13.3% |
| Celtics | 0.0 /100 | #294 | Tragic 13.3% |
| French | 0.0 /100 | #295 | Tragic 13.3% |
| Nepalese | 0.0 /100 | #296 | Tragic 13.3% |
| Slovaks | 0.0 /100 | #297 | Tragic 13.3% |
| Immigrants | Nonimmigrants | 0.0 /100 | #298 | Tragic 13.4% |
| Immigrants | Dominican Republic | 0.0 /100 | #299 | Tragic 13.4% |
| Pennsylvania Germans | 0.0 /100 | #300 | Tragic 13.4% |
| Africans | 0.0 /100 | #301 | Tragic 13.4% |
| Scotch-Irish | 0.0 /100 | #302 | Tragic 13.4% |
| Immigrants | Portugal | 0.0 /100 | #303 | Tragic 13.5% |
| Immigrants | Micronesia | 0.0 /100 | #304 | Tragic 13.5% |
| Dominicans | 0.0 /100 | #305 | Tragic 13.5% |
| French Canadians | 0.0 /100 | #306 | Tragic 13.6% |
| Central American Indians | 0.0 /100 | #307 | Tragic 13.6% |