Spanish vs Immigrants from Netherlands Female Disability
COMPARE
Spanish
Immigrants from Netherlands
Female Disability
Female Disability Comparison
Spanish
Immigrants from Netherlands
13.0%
FEMALE DISABILITY
0.1/ 100
METRIC RATING
277th/ 347
METRIC RANK
11.8%
FEMALE DISABILITY
96.9/ 100
METRIC RATING
121st/ 347
METRIC RANK
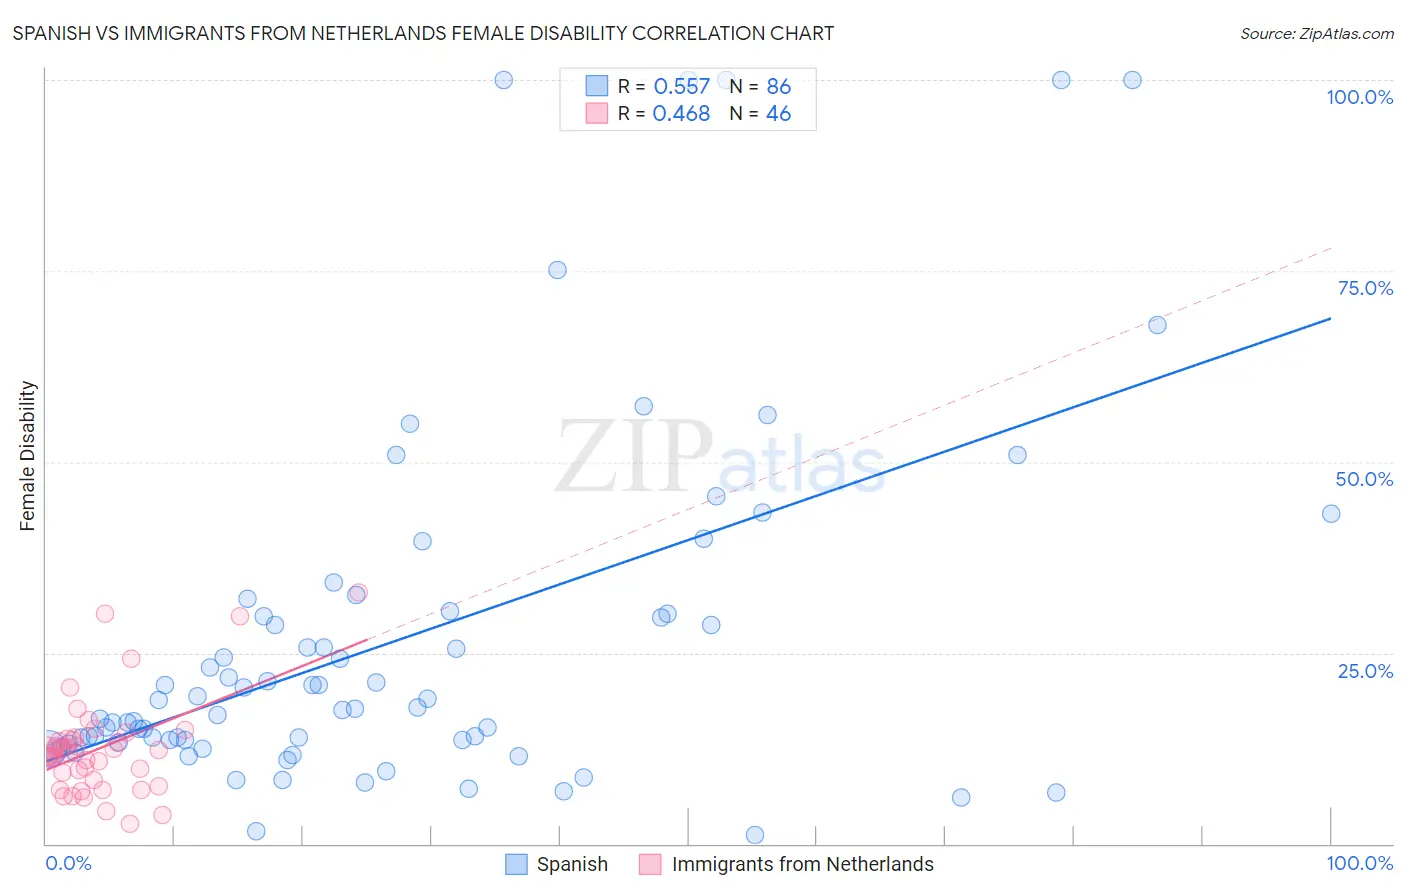
Spanish vs Immigrants from Netherlands Female Disability Correlation Chart
The statistical analysis conducted on geographies consisting of 422,090,479 people shows a substantial positive correlation between the proportion of Spanish and percentage of females with a disability in the United States with a correlation coefficient (R) of 0.557 and weighted average of 13.0%. Similarly, the statistical analysis conducted on geographies consisting of 237,879,368 people shows a moderate positive correlation between the proportion of Immigrants from Netherlands and percentage of females with a disability in the United States with a correlation coefficient (R) of 0.468 and weighted average of 11.8%, a difference of 10.2%.
Female Disability Correlation Summary
| Measurement | Spanish | Immigrants from Netherlands |
| Minimum | 1.1% | 2.6% |
| Maximum | 100.0% | 32.9% |
| Range | 98.9% | 30.2% |
| Mean | 26.7% | 12.5% |
| Median | 17.7% | 12.0% |
| Interquartile 25% (IQ1) | 13.3% | 8.4% |
| Interquartile 75% (IQ3) | 30.0% | 13.8% |
| Interquartile Range (IQR) | 16.8% | 5.4% |
| Standard Deviation (Sample) | 23.4% | 6.4% |
| Standard Deviation (Population) | 23.2% | 6.3% |
Similar Demographics by Female Disability
Demographics Similar to Spanish by Female Disability
In terms of female disability, the demographic groups most similar to Spanish are Scottish (13.0%, a difference of 0.080%), Immigrants from Dominica (13.0%, a difference of 0.20%), Cheyenne (13.0%, a difference of 0.25%), Portuguese (13.0%, a difference of 0.31%), and Arapaho (13.0%, a difference of 0.33%).
| Demographics | Rating | Rank | Female Disability |
| Immigrants | Liberia | 0.3 /100 | #270 | Tragic 12.9% |
| Dutch | 0.2 /100 | #271 | Tragic 12.9% |
| Germans | 0.1 /100 | #272 | Tragic 12.9% |
| Sioux | 0.1 /100 | #273 | Tragic 12.9% |
| Portuguese | 0.1 /100 | #274 | Tragic 13.0% |
| Cheyenne | 0.1 /100 | #275 | Tragic 13.0% |
| Immigrants | Dominica | 0.1 /100 | #276 | Tragic 13.0% |
| Spanish | 0.1 /100 | #277 | Tragic 13.0% |
| Scottish | 0.1 /100 | #278 | Tragic 13.0% |
| Arapaho | 0.1 /100 | #279 | Tragic 13.0% |
| Irish | 0.1 /100 | #280 | Tragic 13.1% |
| U.S. Virgin Islanders | 0.1 /100 | #281 | Tragic 13.1% |
| Welsh | 0.0 /100 | #282 | Tragic 13.1% |
| English | 0.0 /100 | #283 | Tragic 13.1% |
| Hmong | 0.0 /100 | #284 | Tragic 13.1% |
Demographics Similar to Immigrants from Netherlands by Female Disability
In terms of female disability, the demographic groups most similar to Immigrants from Netherlands are Immigrants from North Macedonia (11.8%, a difference of 0.010%), Immigrants from Kazakhstan (11.8%, a difference of 0.030%), Immigrants from Croatia (11.8%, a difference of 0.060%), Immigrants from Eastern Europe (11.8%, a difference of 0.11%), and Immigrants from Nigeria (11.8%, a difference of 0.11%).
| Demographics | Rating | Rank | Female Disability |
| South Africans | 97.7 /100 | #114 | Exceptional 11.8% |
| Brazilians | 97.7 /100 | #115 | Exceptional 11.8% |
| Immigrants | Morocco | 97.6 /100 | #116 | Exceptional 11.8% |
| Immigrants | Eastern Europe | 97.2 /100 | #117 | Exceptional 11.8% |
| Immigrants | Nigeria | 97.2 /100 | #118 | Exceptional 11.8% |
| Immigrants | Uganda | 97.2 /100 | #119 | Exceptional 11.8% |
| Immigrants | Kazakhstan | 97.0 /100 | #120 | Exceptional 11.8% |
| Immigrants | Netherlands | 96.9 /100 | #121 | Exceptional 11.8% |
| Immigrants | North Macedonia | 96.8 /100 | #122 | Exceptional 11.8% |
| Immigrants | Croatia | 96.7 /100 | #123 | Exceptional 11.8% |
| Russians | 96.5 /100 | #124 | Exceptional 11.8% |
| Immigrants | Italy | 96.4 /100 | #125 | Exceptional 11.8% |
| Immigrants | Europe | 96.2 /100 | #126 | Exceptional 11.8% |
| South American Indians | 95.8 /100 | #127 | Exceptional 11.8% |
| Immigrants | Latvia | 95.6 /100 | #128 | Exceptional 11.8% |