Spanish vs Northern European Female Disability
COMPARE
Spanish
Northern European
Female Disability
Female Disability Comparison
Spanish
Northern Europeans
13.0%
FEMALE DISABILITY
0.1/ 100
METRIC RATING
277th/ 347
METRIC RANK
12.3%
FEMALE DISABILITY
27.5/ 100
METRIC RATING
193rd/ 347
METRIC RANK
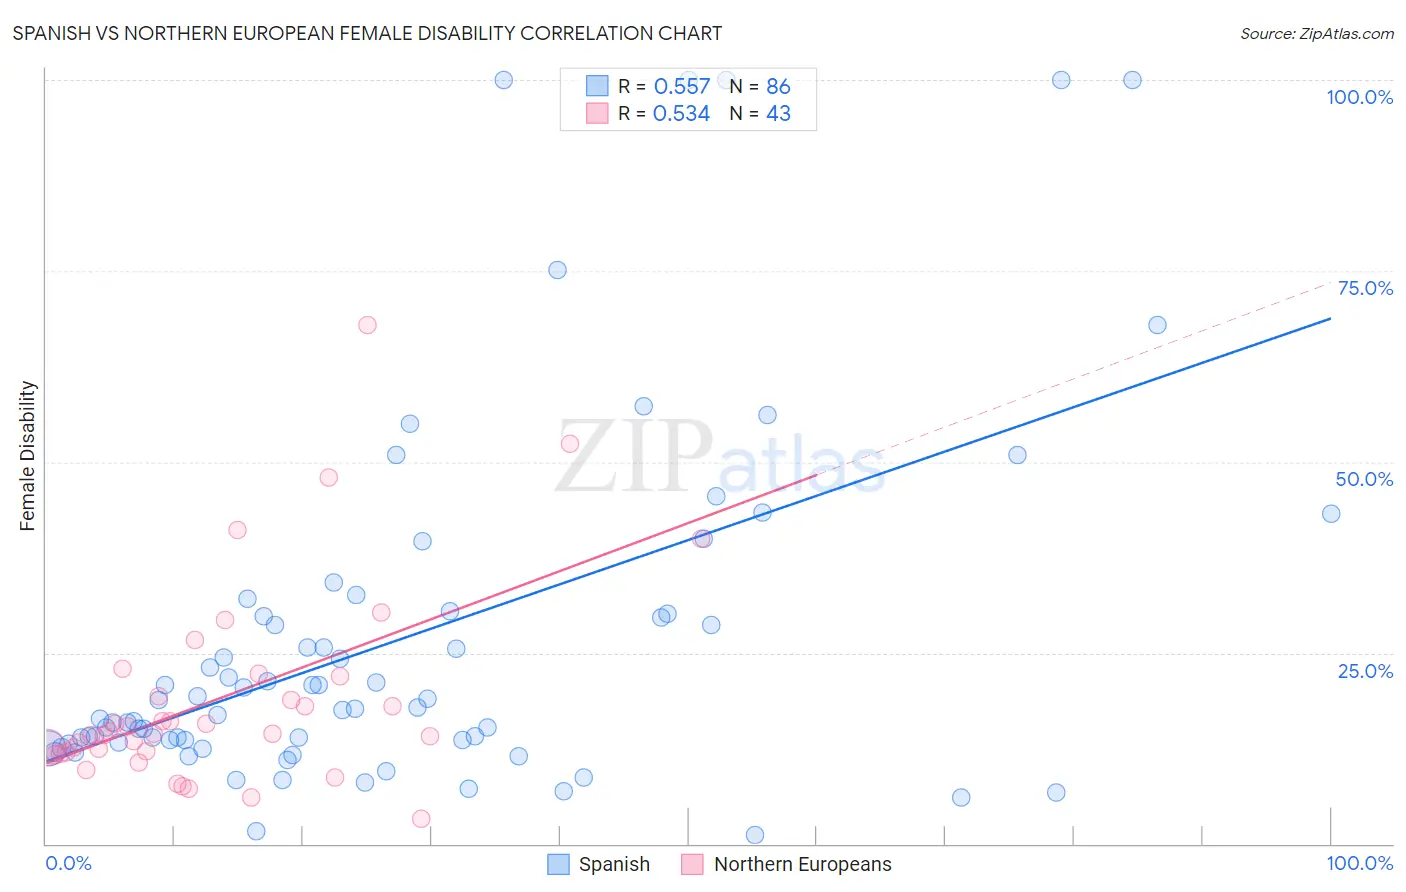
Spanish vs Northern European Female Disability Correlation Chart
The statistical analysis conducted on geographies consisting of 422,090,479 people shows a substantial positive correlation between the proportion of Spanish and percentage of females with a disability in the United States with a correlation coefficient (R) of 0.557 and weighted average of 13.0%. Similarly, the statistical analysis conducted on geographies consisting of 406,028,817 people shows a substantial positive correlation between the proportion of Northern Europeans and percentage of females with a disability in the United States with a correlation coefficient (R) of 0.534 and weighted average of 12.3%, a difference of 5.7%.
Female Disability Correlation Summary
| Measurement | Spanish | Northern European |
| Minimum | 1.1% | 3.3% |
| Maximum | 100.0% | 68.0% |
| Range | 98.9% | 64.7% |
| Mean | 26.7% | 18.9% |
| Median | 17.7% | 14.4% |
| Interquartile 25% (IQ1) | 13.3% | 12.0% |
| Interquartile 75% (IQ3) | 30.0% | 22.0% |
| Interquartile Range (IQR) | 16.8% | 10.0% |
| Standard Deviation (Sample) | 23.4% | 13.1% |
| Standard Deviation (Population) | 23.2% | 13.0% |
Similar Demographics by Female Disability
Demographics Similar to Spanish by Female Disability
In terms of female disability, the demographic groups most similar to Spanish are Scottish (13.0%, a difference of 0.080%), Immigrants from Dominica (13.0%, a difference of 0.20%), Cheyenne (13.0%, a difference of 0.25%), Portuguese (13.0%, a difference of 0.31%), and Arapaho (13.0%, a difference of 0.33%).
| Demographics | Rating | Rank | Female Disability |
| Immigrants | Liberia | 0.3 /100 | #270 | Tragic 12.9% |
| Dutch | 0.2 /100 | #271 | Tragic 12.9% |
| Germans | 0.1 /100 | #272 | Tragic 12.9% |
| Sioux | 0.1 /100 | #273 | Tragic 12.9% |
| Portuguese | 0.1 /100 | #274 | Tragic 13.0% |
| Cheyenne | 0.1 /100 | #275 | Tragic 13.0% |
| Immigrants | Dominica | 0.1 /100 | #276 | Tragic 13.0% |
| Spanish | 0.1 /100 | #277 | Tragic 13.0% |
| Scottish | 0.1 /100 | #278 | Tragic 13.0% |
| Arapaho | 0.1 /100 | #279 | Tragic 13.0% |
| Irish | 0.1 /100 | #280 | Tragic 13.1% |
| U.S. Virgin Islanders | 0.1 /100 | #281 | Tragic 13.1% |
| Welsh | 0.0 /100 | #282 | Tragic 13.1% |
| English | 0.0 /100 | #283 | Tragic 13.1% |
| Hmong | 0.0 /100 | #284 | Tragic 13.1% |
Demographics Similar to Northern Europeans by Female Disability
In terms of female disability, the demographic groups most similar to Northern Europeans are Ukrainian (12.3%, a difference of 0.010%), Swedish (12.3%, a difference of 0.040%), Immigrants from Western Africa (12.3%, a difference of 0.080%), Armenian (12.3%, a difference of 0.10%), and Immigrants from Panama (12.3%, a difference of 0.10%).
| Demographics | Rating | Rank | Female Disability |
| Austrians | 33.3 /100 | #186 | Fair 12.3% |
| Serbians | 33.1 /100 | #187 | Fair 12.3% |
| Immigrants | North America | 32.8 /100 | #188 | Fair 12.3% |
| Immigrants | Albania | 31.6 /100 | #189 | Fair 12.3% |
| Immigrants | Honduras | 31.3 /100 | #190 | Fair 12.3% |
| Armenians | 29.7 /100 | #191 | Fair 12.3% |
| Immigrants | Western Africa | 29.2 /100 | #192 | Fair 12.3% |
| Northern Europeans | 27.5 /100 | #193 | Fair 12.3% |
| Ukrainians | 27.2 /100 | #194 | Fair 12.3% |
| Swedes | 26.6 /100 | #195 | Fair 12.3% |
| Immigrants | Panama | 25.5 /100 | #196 | Fair 12.3% |
| Hondurans | 25.4 /100 | #197 | Fair 12.3% |
| Mexican American Indians | 24.9 /100 | #198 | Fair 12.3% |
| Immigrants | Trinidad and Tobago | 24.7 /100 | #199 | Fair 12.3% |
| Trinidadians and Tobagonians | 22.4 /100 | #200 | Fair 12.3% |