Soviet Union vs Scandinavian Hearing Disability
COMPARE
Soviet Union
Scandinavian
Hearing Disability
Hearing Disability Comparison
Soviet Union
Scandinavians
2.9%
HEARING DISABILITY
84.8/ 100
METRIC RATING
135th/ 347
METRIC RANK
3.6%
HEARING DISABILITY
0.0/ 100
METRIC RATING
281st/ 347
METRIC RANK
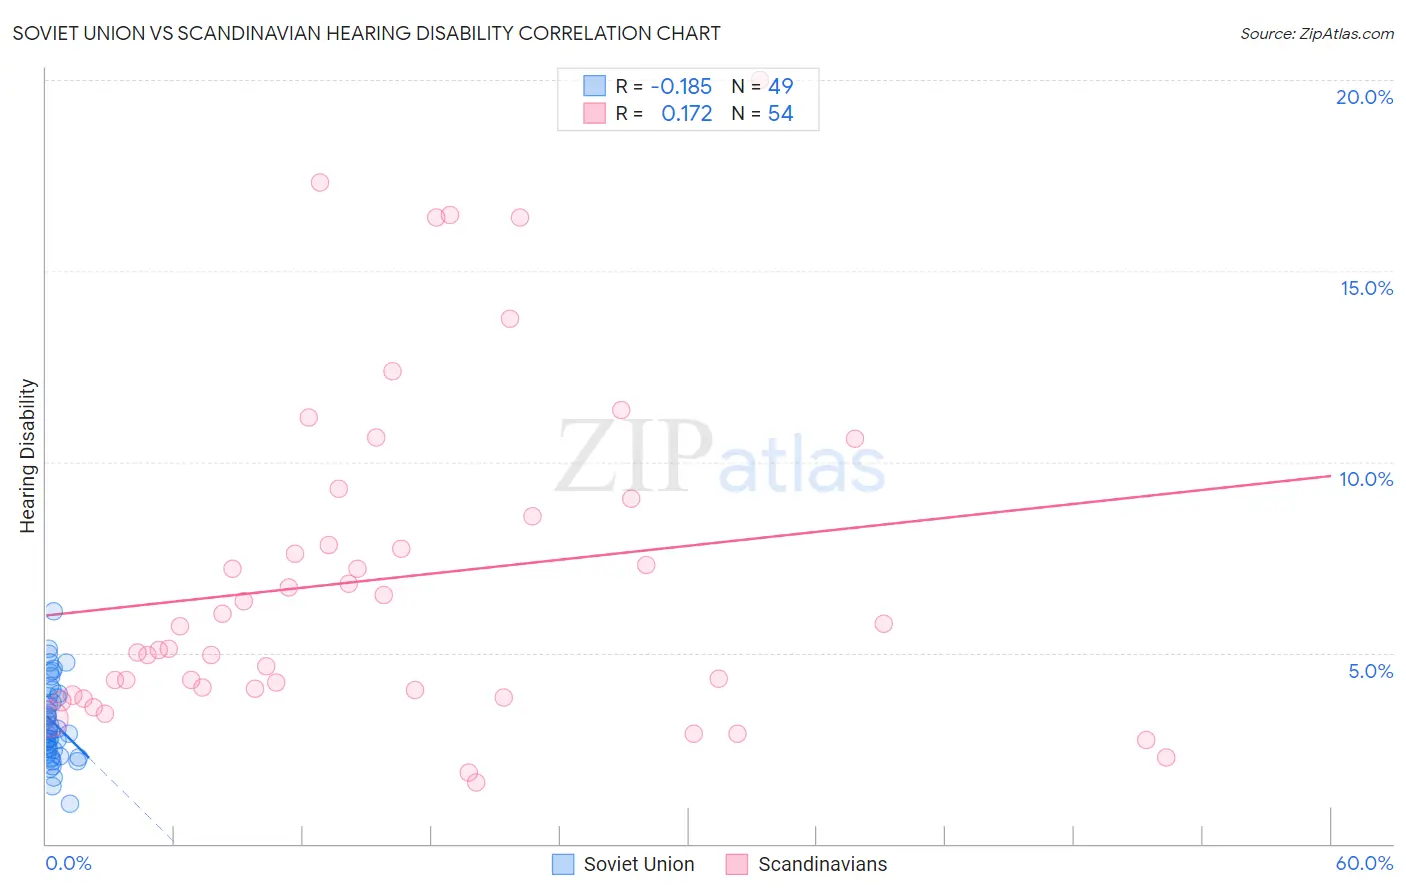
Soviet Union vs Scandinavian Hearing Disability Correlation Chart
The statistical analysis conducted on geographies consisting of 43,504,651 people shows a poor negative correlation between the proportion of Soviet Union and percentage of population with hearing disability in the United States with a correlation coefficient (R) of -0.185 and weighted average of 2.9%. Similarly, the statistical analysis conducted on geographies consisting of 472,380,661 people shows a poor positive correlation between the proportion of Scandinavians and percentage of population with hearing disability in the United States with a correlation coefficient (R) of 0.172 and weighted average of 3.6%, a difference of 25.5%.
Hearing Disability Correlation Summary
| Measurement | Soviet Union | Scandinavian |
| Minimum | 1.0% | 1.6% |
| Maximum | 6.1% | 20.0% |
| Range | 5.1% | 18.4% |
| Mean | 3.2% | 6.9% |
| Median | 3.0% | 5.4% |
| Interquartile 25% (IQ1) | 2.4% | 4.0% |
| Interquartile 75% (IQ3) | 3.9% | 8.6% |
| Interquartile Range (IQR) | 1.5% | 4.6% |
| Standard Deviation (Sample) | 1.0% | 4.3% |
| Standard Deviation (Population) | 1.0% | 4.3% |
Similar Demographics by Hearing Disability
Demographics Similar to Soviet Union by Hearing Disability
In terms of hearing disability, the demographic groups most similar to Soviet Union are Immigrants from Brazil (2.9%, a difference of 0.030%), Sri Lankan (2.9%, a difference of 0.13%), Immigrants from Costa Rica (2.9%, a difference of 0.13%), Ugandan (2.9%, a difference of 0.14%), and Bermudan (2.9%, a difference of 0.18%).
| Demographics | Rating | Rank | Hearing Disability |
| Immigrants | Western Asia | 86.9 /100 | #128 | Excellent 2.9% |
| Immigrants | Uganda | 86.6 /100 | #129 | Excellent 2.9% |
| Immigrants | Vietnam | 86.5 /100 | #130 | Excellent 2.9% |
| Immigrants | Kenya | 86.1 /100 | #131 | Excellent 2.9% |
| Chileans | 85.8 /100 | #132 | Excellent 2.9% |
| Immigrants | Syria | 85.8 /100 | #133 | Excellent 2.9% |
| Ugandans | 85.5 /100 | #134 | Excellent 2.9% |
| Soviet Union | 84.8 /100 | #135 | Excellent 2.9% |
| Immigrants | Brazil | 84.6 /100 | #136 | Excellent 2.9% |
| Sri Lankans | 84.1 /100 | #137 | Excellent 2.9% |
| Immigrants | Costa Rica | 84.0 /100 | #138 | Excellent 2.9% |
| Bermudans | 83.8 /100 | #139 | Excellent 2.9% |
| Immigrants | Jordan | 83.7 /100 | #140 | Excellent 2.9% |
| Sub-Saharan Africans | 83.3 /100 | #141 | Excellent 2.9% |
| Laotians | 81.1 /100 | #142 | Excellent 2.9% |
Demographics Similar to Scandinavians by Hearing Disability
In terms of hearing disability, the demographic groups most similar to Scandinavians are French American Indian (3.6%, a difference of 0.060%), Swedish (3.6%, a difference of 0.090%), Slovak (3.6%, a difference of 0.12%), Blackfeet (3.6%, a difference of 0.34%), and Basque (3.6%, a difference of 0.39%).
| Demographics | Rating | Rank | Hearing Disability |
| Swiss | 0.0 /100 | #274 | Tragic 3.5% |
| Czechoslovakians | 0.0 /100 | #275 | Tragic 3.6% |
| Danes | 0.0 /100 | #276 | Tragic 3.6% |
| Immigrants | Nonimmigrants | 0.0 /100 | #277 | Tragic 3.6% |
| Basques | 0.0 /100 | #278 | Tragic 3.6% |
| Slovaks | 0.0 /100 | #279 | Tragic 3.6% |
| French American Indians | 0.0 /100 | #280 | Tragic 3.6% |
| Scandinavians | 0.0 /100 | #281 | Tragic 3.6% |
| Swedes | 0.0 /100 | #282 | Tragic 3.6% |
| Blackfeet | 0.0 /100 | #283 | Tragic 3.6% |
| Immigrants | Micronesia | 0.0 /100 | #284 | Tragic 3.6% |
| Sioux | 0.0 /100 | #285 | Tragic 3.6% |
| Delaware | 0.0 /100 | #286 | Tragic 3.6% |
| Spanish | 0.0 /100 | #287 | Tragic 3.7% |
| Irish | 0.0 /100 | #288 | Tragic 3.7% |