South African vs Scandinavian Hearing Disability
COMPARE
South African
Scandinavian
Hearing Disability
Hearing Disability Comparison
South Africans
Scandinavians
3.1%
HEARING DISABILITY
24.5/ 100
METRIC RATING
194th/ 347
METRIC RANK
3.6%
HEARING DISABILITY
0.0/ 100
METRIC RATING
281st/ 347
METRIC RANK
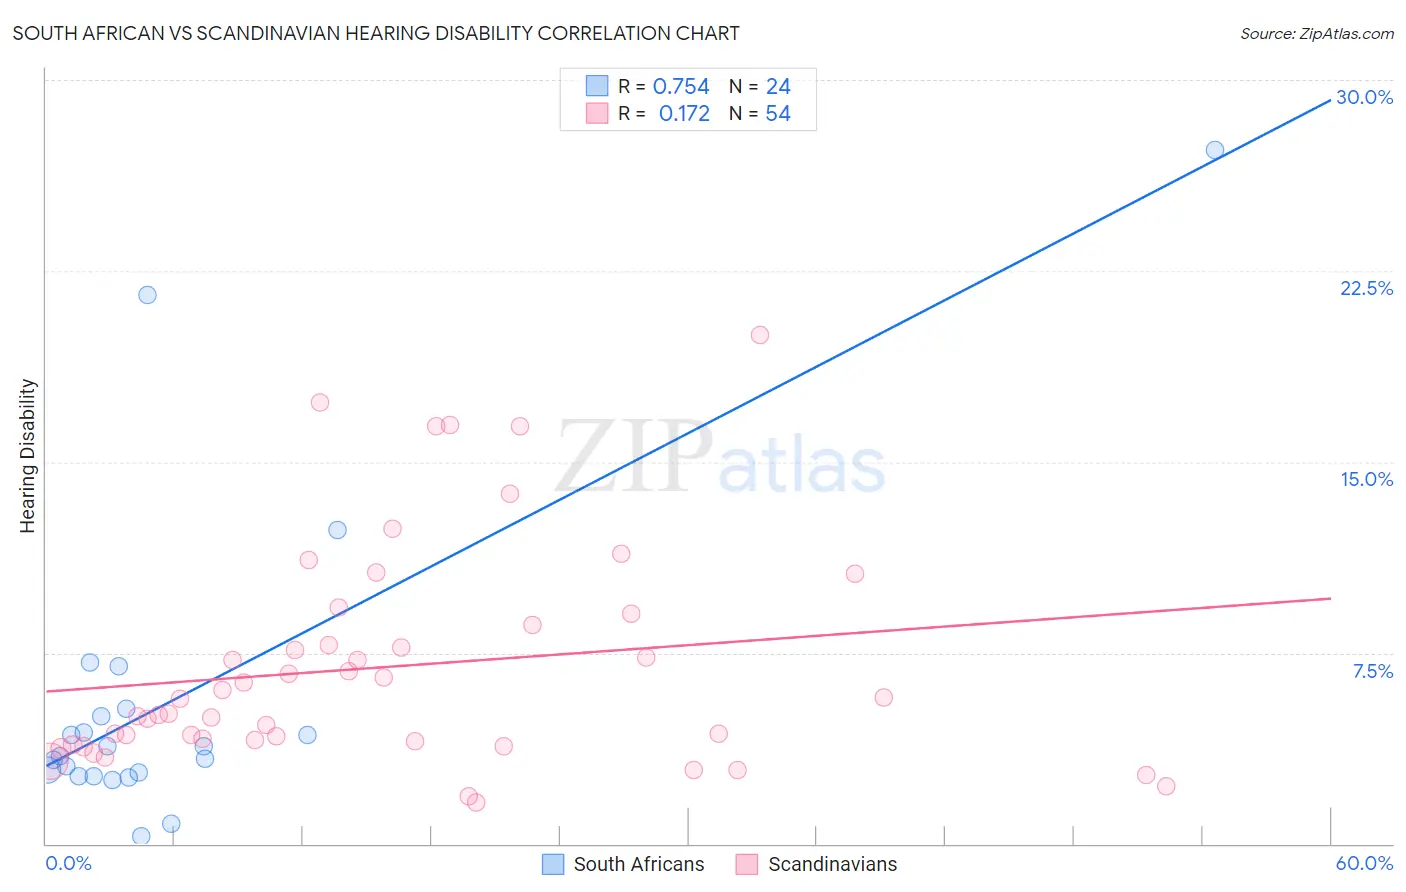
South African vs Scandinavian Hearing Disability Correlation Chart
The statistical analysis conducted on geographies consisting of 182,558,615 people shows a strong positive correlation between the proportion of South Africans and percentage of population with hearing disability in the United States with a correlation coefficient (R) of 0.754 and weighted average of 3.1%. Similarly, the statistical analysis conducted on geographies consisting of 472,380,661 people shows a poor positive correlation between the proportion of Scandinavians and percentage of population with hearing disability in the United States with a correlation coefficient (R) of 0.172 and weighted average of 3.6%, a difference of 17.4%.
Hearing Disability Correlation Summary
| Measurement | South African | Scandinavian |
| Minimum | 0.31% | 1.6% |
| Maximum | 27.3% | 20.0% |
| Range | 27.0% | 18.4% |
| Mean | 5.7% | 6.9% |
| Median | 3.6% | 5.4% |
| Interquartile 25% (IQ1) | 2.7% | 4.0% |
| Interquartile 75% (IQ3) | 5.2% | 8.6% |
| Interquartile Range (IQR) | 2.4% | 4.6% |
| Standard Deviation (Sample) | 6.3% | 4.3% |
| Standard Deviation (Population) | 6.2% | 4.3% |
Similar Demographics by Hearing Disability
Demographics Similar to South Africans by Hearing Disability
In terms of hearing disability, the demographic groups most similar to South Africans are Spanish American Indian (3.1%, a difference of 0.050%), Immigrants from Europe (3.1%, a difference of 0.21%), Macedonian (3.1%, a difference of 0.30%), Korean (3.1%, a difference of 0.37%), and Immigrants from Switzerland (3.1%, a difference of 0.51%).
| Demographics | Rating | Rank | Hearing Disability |
| Blacks/African Americans | 34.7 /100 | #187 | Fair 3.0% |
| Mexican American Indians | 34.7 /100 | #188 | Fair 3.0% |
| Africans | 32.9 /100 | #189 | Fair 3.0% |
| Immigrants | South Africa | 31.1 /100 | #190 | Fair 3.1% |
| Immigrants | Switzerland | 28.8 /100 | #191 | Fair 3.1% |
| Koreans | 27.6 /100 | #192 | Fair 3.1% |
| Macedonians | 27.0 /100 | #193 | Fair 3.1% |
| South Africans | 24.5 /100 | #194 | Fair 3.1% |
| Spanish American Indians | 24.1 /100 | #195 | Fair 3.1% |
| Immigrants | Europe | 22.9 /100 | #196 | Fair 3.1% |
| Immigrants | Bosnia and Herzegovina | 20.6 /100 | #197 | Fair 3.1% |
| Immigrants | Croatia | 20.5 /100 | #198 | Fair 3.1% |
| Syrians | 19.2 /100 | #199 | Poor 3.1% |
| Immigrants | North Macedonia | 19.1 /100 | #200 | Poor 3.1% |
| Iraqis | 19.0 /100 | #201 | Poor 3.1% |
Demographics Similar to Scandinavians by Hearing Disability
In terms of hearing disability, the demographic groups most similar to Scandinavians are French American Indian (3.6%, a difference of 0.060%), Swedish (3.6%, a difference of 0.090%), Slovak (3.6%, a difference of 0.12%), Blackfeet (3.6%, a difference of 0.34%), and Basque (3.6%, a difference of 0.39%).
| Demographics | Rating | Rank | Hearing Disability |
| Swiss | 0.0 /100 | #274 | Tragic 3.5% |
| Czechoslovakians | 0.0 /100 | #275 | Tragic 3.6% |
| Danes | 0.0 /100 | #276 | Tragic 3.6% |
| Immigrants | Nonimmigrants | 0.0 /100 | #277 | Tragic 3.6% |
| Basques | 0.0 /100 | #278 | Tragic 3.6% |
| Slovaks | 0.0 /100 | #279 | Tragic 3.6% |
| French American Indians | 0.0 /100 | #280 | Tragic 3.6% |
| Scandinavians | 0.0 /100 | #281 | Tragic 3.6% |
| Swedes | 0.0 /100 | #282 | Tragic 3.6% |
| Blackfeet | 0.0 /100 | #283 | Tragic 3.6% |
| Immigrants | Micronesia | 0.0 /100 | #284 | Tragic 3.6% |
| Sioux | 0.0 /100 | #285 | Tragic 3.6% |
| Delaware | 0.0 /100 | #286 | Tragic 3.6% |
| Spanish | 0.0 /100 | #287 | Tragic 3.7% |
| Irish | 0.0 /100 | #288 | Tragic 3.7% |