Soviet Union vs Malaysian Hearing Disability
COMPARE
Soviet Union
Malaysian
Hearing Disability
Hearing Disability Comparison
Soviet Union
Malaysians
2.9%
HEARING DISABILITY
84.8/ 100
METRIC RATING
135th/ 347
METRIC RANK
3.2%
HEARING DISABILITY
6.6/ 100
METRIC RATING
220th/ 347
METRIC RANK
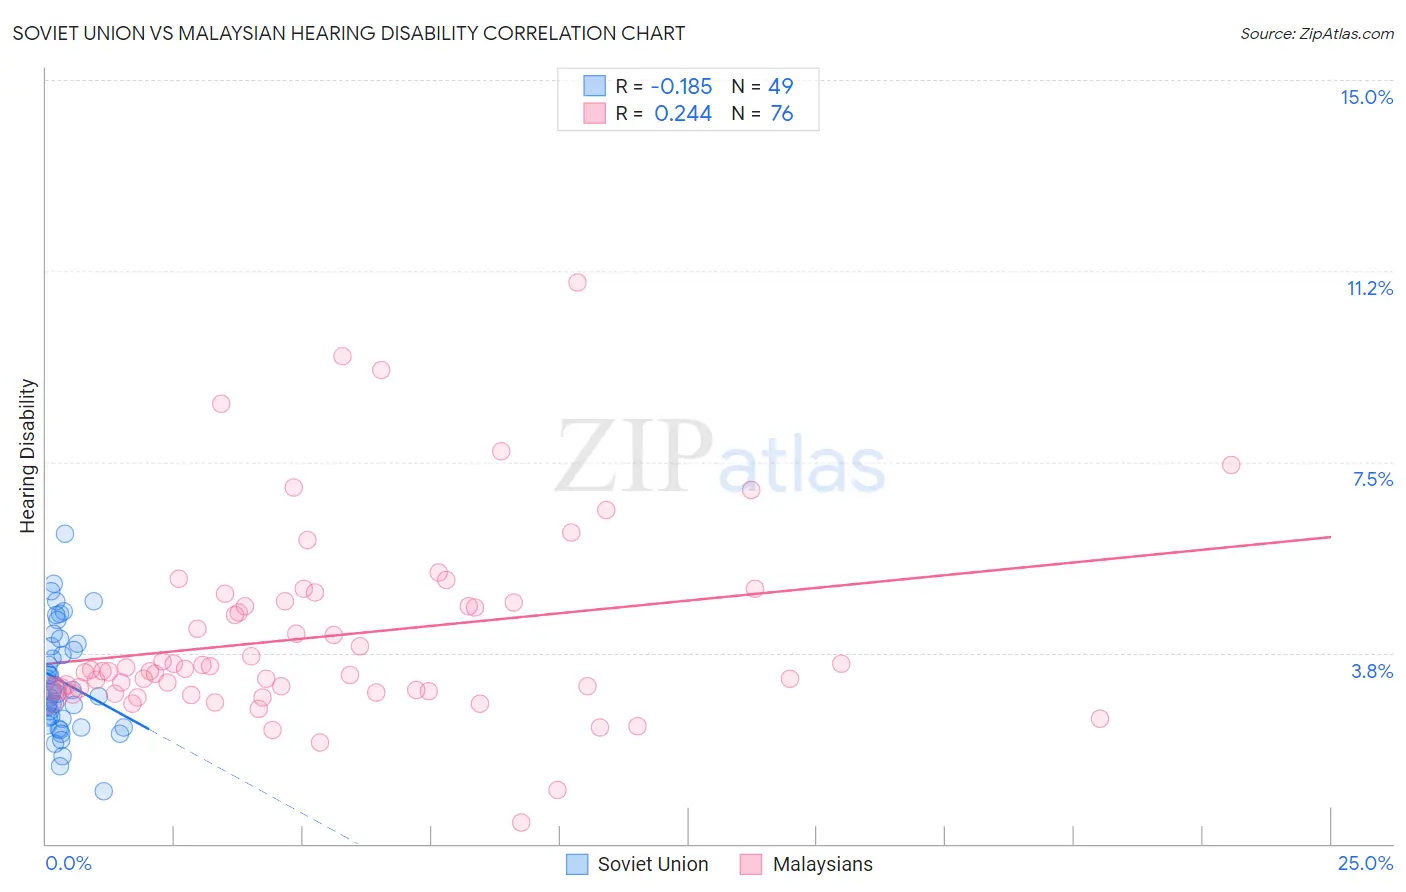
Soviet Union vs Malaysian Hearing Disability Correlation Chart
The statistical analysis conducted on geographies consisting of 43,504,651 people shows a poor negative correlation between the proportion of Soviet Union and percentage of population with hearing disability in the United States with a correlation coefficient (R) of -0.185 and weighted average of 2.9%. Similarly, the statistical analysis conducted on geographies consisting of 226,034,650 people shows a weak positive correlation between the proportion of Malaysians and percentage of population with hearing disability in the United States with a correlation coefficient (R) of 0.244 and weighted average of 3.2%, a difference of 10.7%.
Hearing Disability Correlation Summary
| Measurement | Soviet Union | Malaysian |
| Minimum | 1.0% | 0.43% |
| Maximum | 6.1% | 11.0% |
| Range | 5.1% | 10.6% |
| Mean | 3.2% | 4.1% |
| Median | 3.0% | 3.4% |
| Interquartile 25% (IQ1) | 2.4% | 3.0% |
| Interquartile 75% (IQ3) | 3.9% | 4.8% |
| Interquartile Range (IQR) | 1.5% | 1.7% |
| Standard Deviation (Sample) | 1.0% | 1.9% |
| Standard Deviation (Population) | 1.0% | 1.9% |
Similar Demographics by Hearing Disability
Demographics Similar to Soviet Union by Hearing Disability
In terms of hearing disability, the demographic groups most similar to Soviet Union are Immigrants from Brazil (2.9%, a difference of 0.030%), Sri Lankan (2.9%, a difference of 0.13%), Immigrants from Costa Rica (2.9%, a difference of 0.13%), Ugandan (2.9%, a difference of 0.14%), and Bermudan (2.9%, a difference of 0.18%).
| Demographics | Rating | Rank | Hearing Disability |
| Immigrants | Western Asia | 86.9 /100 | #128 | Excellent 2.9% |
| Immigrants | Uganda | 86.6 /100 | #129 | Excellent 2.9% |
| Immigrants | Vietnam | 86.5 /100 | #130 | Excellent 2.9% |
| Immigrants | Kenya | 86.1 /100 | #131 | Excellent 2.9% |
| Chileans | 85.8 /100 | #132 | Excellent 2.9% |
| Immigrants | Syria | 85.8 /100 | #133 | Excellent 2.9% |
| Ugandans | 85.5 /100 | #134 | Excellent 2.9% |
| Soviet Union | 84.8 /100 | #135 | Excellent 2.9% |
| Immigrants | Brazil | 84.6 /100 | #136 | Excellent 2.9% |
| Sri Lankans | 84.1 /100 | #137 | Excellent 2.9% |
| Immigrants | Costa Rica | 84.0 /100 | #138 | Excellent 2.9% |
| Bermudans | 83.8 /100 | #139 | Excellent 2.9% |
| Immigrants | Jordan | 83.7 /100 | #140 | Excellent 2.9% |
| Sub-Saharan Africans | 83.3 /100 | #141 | Excellent 2.9% |
| Laotians | 81.1 /100 | #142 | Excellent 2.9% |
Demographics Similar to Malaysians by Hearing Disability
In terms of hearing disability, the demographic groups most similar to Malaysians are Immigrants from Laos (3.2%, a difference of 0.0%), Immigrants from Oceania (3.2%, a difference of 0.040%), New Zealander (3.2%, a difference of 0.060%), Immigrants from Northern Europe (3.2%, a difference of 0.12%), and Russian (3.2%, a difference of 0.16%).
| Demographics | Rating | Rank | Hearing Disability |
| Immigrants | Iraq | 10.5 /100 | #213 | Poor 3.1% |
| Australians | 8.1 /100 | #214 | Tragic 3.2% |
| Bangladeshis | 8.1 /100 | #215 | Tragic 3.2% |
| Immigrants | Norway | 7.3 /100 | #216 | Tragic 3.2% |
| Russians | 7.1 /100 | #217 | Tragic 3.2% |
| Immigrants | Northern Europe | 7.0 /100 | #218 | Tragic 3.2% |
| New Zealanders | 6.8 /100 | #219 | Tragic 3.2% |
| Malaysians | 6.6 /100 | #220 | Tragic 3.2% |
| Immigrants | Laos | 6.6 /100 | #221 | Tragic 3.2% |
| Immigrants | Oceania | 6.5 /100 | #222 | Tragic 3.2% |
| Mexicans | 5.6 /100 | #223 | Tragic 3.2% |
| Icelanders | 5.2 /100 | #224 | Tragic 3.2% |
| Latvians | 5.1 /100 | #225 | Tragic 3.2% |
| Lebanese | 5.0 /100 | #226 | Tragic 3.2% |
| Bhutanese | 4.6 /100 | #227 | Tragic 3.2% |