Lebanese vs Scandinavian Hearing Disability
COMPARE
Lebanese
Scandinavian
Hearing Disability
Hearing Disability Comparison
Lebanese
Scandinavians
3.2%
HEARING DISABILITY
5.0/ 100
METRIC RATING
226th/ 347
METRIC RANK
3.6%
HEARING DISABILITY
0.0/ 100
METRIC RATING
281st/ 347
METRIC RANK
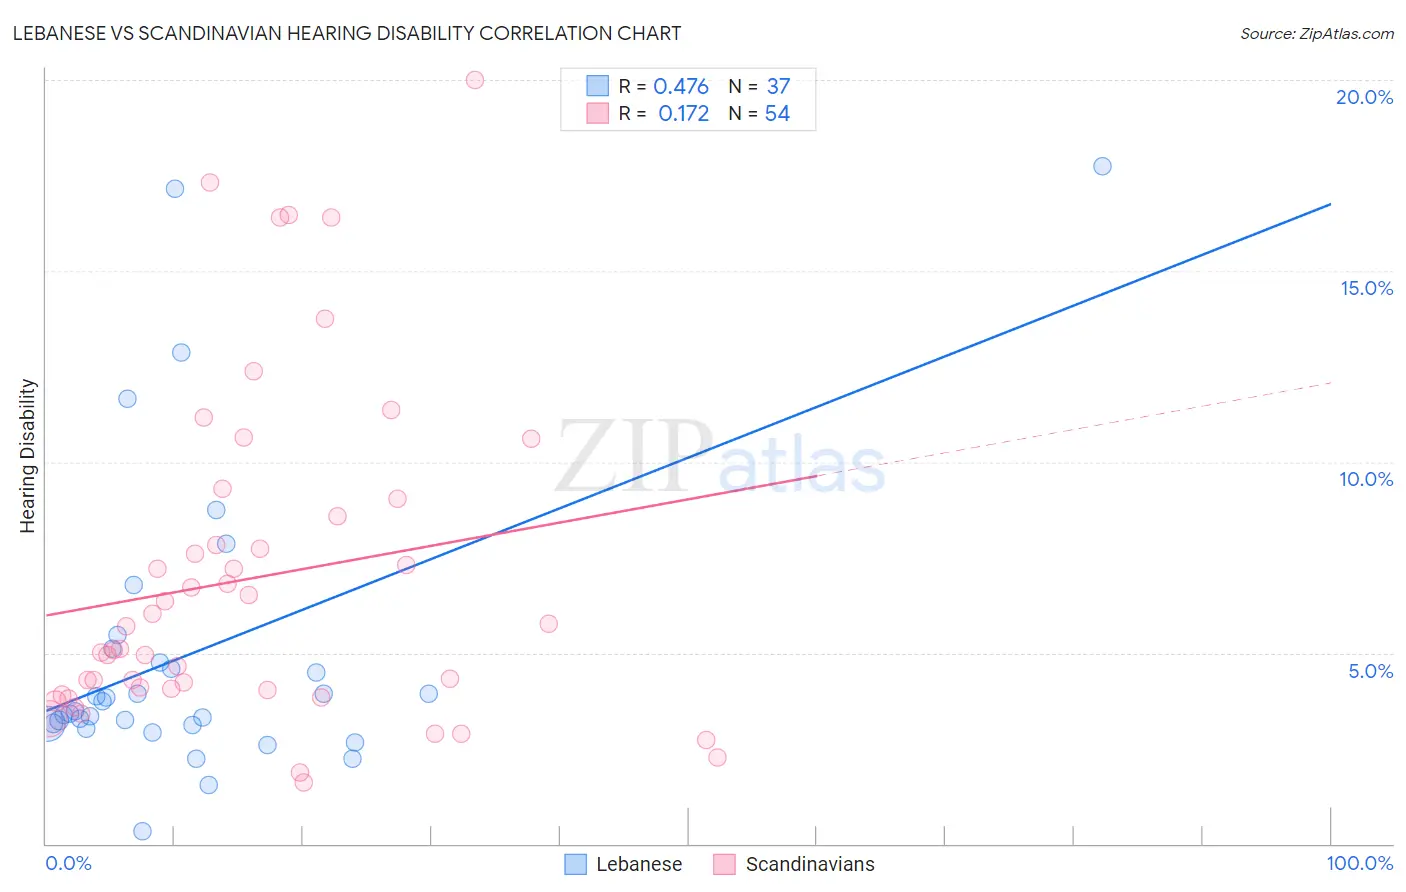
Lebanese vs Scandinavian Hearing Disability Correlation Chart
The statistical analysis conducted on geographies consisting of 401,493,679 people shows a moderate positive correlation between the proportion of Lebanese and percentage of population with hearing disability in the United States with a correlation coefficient (R) of 0.476 and weighted average of 3.2%. Similarly, the statistical analysis conducted on geographies consisting of 472,380,661 people shows a poor positive correlation between the proportion of Scandinavians and percentage of population with hearing disability in the United States with a correlation coefficient (R) of 0.172 and weighted average of 3.6%, a difference of 12.7%.
Hearing Disability Correlation Summary
| Measurement | Lebanese | Scandinavian |
| Minimum | 0.31% | 1.6% |
| Maximum | 17.8% | 20.0% |
| Range | 17.4% | 18.4% |
| Mean | 5.0% | 6.9% |
| Median | 3.5% | 5.4% |
| Interquartile 25% (IQ1) | 3.1% | 4.0% |
| Interquartile 75% (IQ3) | 4.9% | 8.6% |
| Interquartile Range (IQR) | 1.8% | 4.6% |
| Standard Deviation (Sample) | 3.9% | 4.3% |
| Standard Deviation (Population) | 3.9% | 4.3% |
Similar Demographics by Hearing Disability
Demographics Similar to Lebanese by Hearing Disability
In terms of hearing disability, the demographic groups most similar to Lebanese are Latvian (3.2%, a difference of 0.040%), Icelander (3.2%, a difference of 0.090%), Bhutanese (3.2%, a difference of 0.18%), Mexican (3.2%, a difference of 0.25%), and Immigrants from Portugal (3.2%, a difference of 0.38%).
| Demographics | Rating | Rank | Hearing Disability |
| New Zealanders | 6.8 /100 | #219 | Tragic 3.2% |
| Malaysians | 6.6 /100 | #220 | Tragic 3.2% |
| Immigrants | Laos | 6.6 /100 | #221 | Tragic 3.2% |
| Immigrants | Oceania | 6.5 /100 | #222 | Tragic 3.2% |
| Mexicans | 5.6 /100 | #223 | Tragic 3.2% |
| Icelanders | 5.2 /100 | #224 | Tragic 3.2% |
| Latvians | 5.1 /100 | #225 | Tragic 3.2% |
| Lebanese | 5.0 /100 | #226 | Tragic 3.2% |
| Bhutanese | 4.6 /100 | #227 | Tragic 3.2% |
| Immigrants | Portugal | 4.3 /100 | #228 | Tragic 3.2% |
| Maltese | 4.1 /100 | #229 | Tragic 3.2% |
| Greeks | 3.2 /100 | #230 | Tragic 3.2% |
| Luxembourgers | 2.9 /100 | #231 | Tragic 3.2% |
| Ukrainians | 2.9 /100 | #232 | Tragic 3.2% |
| Estonians | 2.4 /100 | #233 | Tragic 3.3% |
Demographics Similar to Scandinavians by Hearing Disability
In terms of hearing disability, the demographic groups most similar to Scandinavians are French American Indian (3.6%, a difference of 0.060%), Swedish (3.6%, a difference of 0.090%), Slovak (3.6%, a difference of 0.12%), Blackfeet (3.6%, a difference of 0.34%), and Basque (3.6%, a difference of 0.39%).
| Demographics | Rating | Rank | Hearing Disability |
| Swiss | 0.0 /100 | #274 | Tragic 3.5% |
| Czechoslovakians | 0.0 /100 | #275 | Tragic 3.6% |
| Danes | 0.0 /100 | #276 | Tragic 3.6% |
| Immigrants | Nonimmigrants | 0.0 /100 | #277 | Tragic 3.6% |
| Basques | 0.0 /100 | #278 | Tragic 3.6% |
| Slovaks | 0.0 /100 | #279 | Tragic 3.6% |
| French American Indians | 0.0 /100 | #280 | Tragic 3.6% |
| Scandinavians | 0.0 /100 | #281 | Tragic 3.6% |
| Swedes | 0.0 /100 | #282 | Tragic 3.6% |
| Blackfeet | 0.0 /100 | #283 | Tragic 3.6% |
| Immigrants | Micronesia | 0.0 /100 | #284 | Tragic 3.6% |
| Sioux | 0.0 /100 | #285 | Tragic 3.6% |
| Delaware | 0.0 /100 | #286 | Tragic 3.6% |
| Spanish | 0.0 /100 | #287 | Tragic 3.7% |
| Irish | 0.0 /100 | #288 | Tragic 3.7% |