Potawatomi vs Scandinavian Hearing Disability
COMPARE
Potawatomi
Scandinavian
Hearing Disability
Hearing Disability Comparison
Potawatomi
Scandinavians
4.1%
HEARING DISABILITY
0.0/ 100
METRIC RATING
326th/ 347
METRIC RANK
3.6%
HEARING DISABILITY
0.0/ 100
METRIC RATING
281st/ 347
METRIC RANK
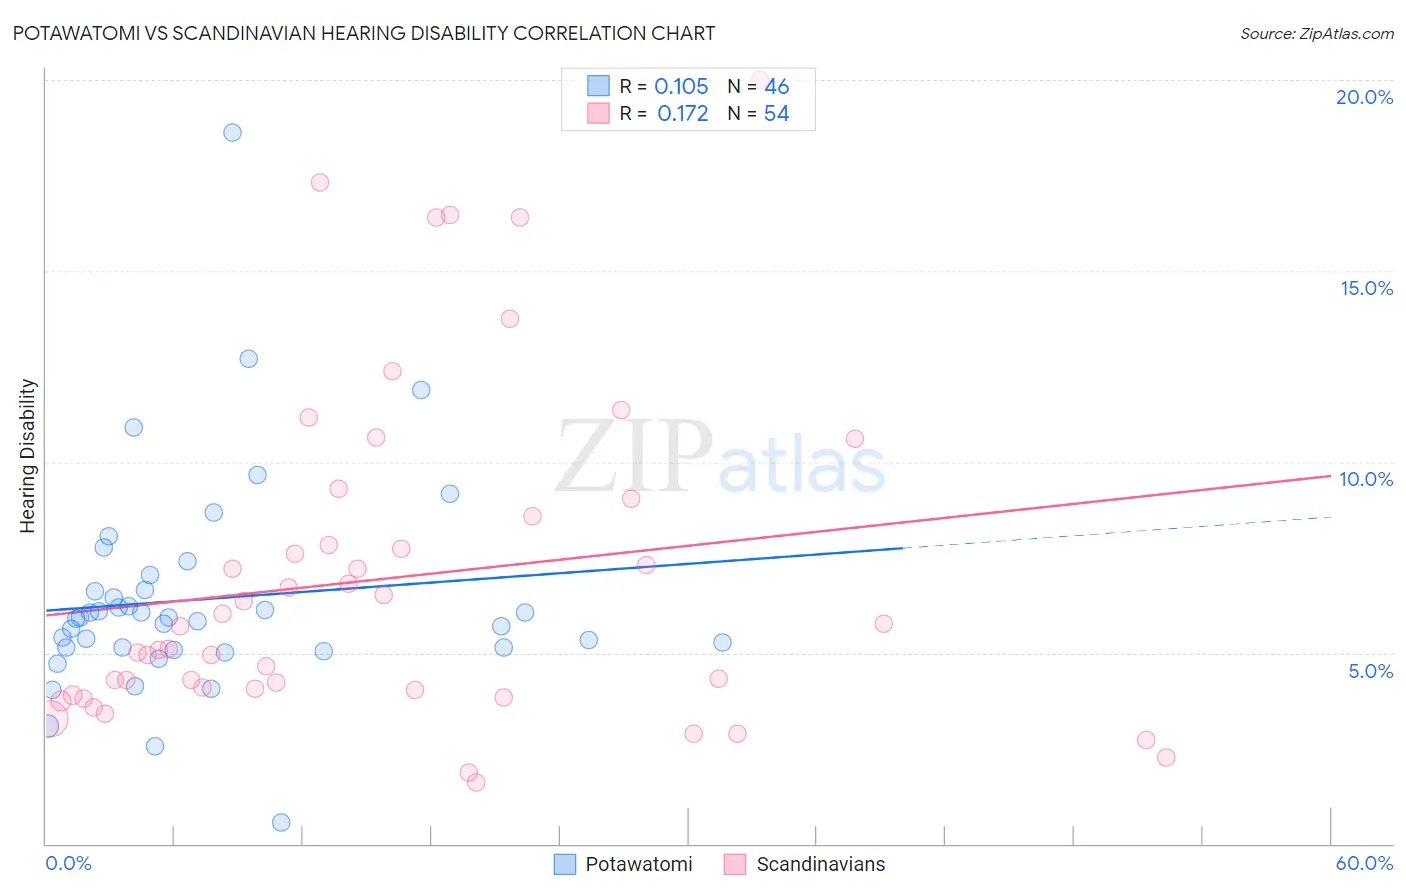
Potawatomi vs Scandinavian Hearing Disability Correlation Chart
The statistical analysis conducted on geographies consisting of 117,759,395 people shows a poor positive correlation between the proportion of Potawatomi and percentage of population with hearing disability in the United States with a correlation coefficient (R) of 0.105 and weighted average of 4.1%. Similarly, the statistical analysis conducted on geographies consisting of 472,380,661 people shows a poor positive correlation between the proportion of Scandinavians and percentage of population with hearing disability in the United States with a correlation coefficient (R) of 0.172 and weighted average of 3.6%, a difference of 14.2%.
Hearing Disability Correlation Summary
| Measurement | Potawatomi | Scandinavian |
| Minimum | 0.55% | 1.6% |
| Maximum | 18.6% | 20.0% |
| Range | 18.1% | 18.4% |
| Mean | 6.4% | 6.9% |
| Median | 5.9% | 5.4% |
| Interquartile 25% (IQ1) | 5.1% | 4.0% |
| Interquartile 75% (IQ3) | 6.6% | 8.6% |
| Interquartile Range (IQR) | 1.5% | 4.6% |
| Standard Deviation (Sample) | 2.9% | 4.3% |
| Standard Deviation (Population) | 2.8% | 4.3% |
Similar Demographics by Hearing Disability
Demographics Similar to Potawatomi by Hearing Disability
In terms of hearing disability, the demographic groups most similar to Potawatomi are Lumbee (4.1%, a difference of 0.29%), Osage (4.1%, a difference of 0.61%), Apache (4.1%, a difference of 0.68%), Arapaho (4.1%, a difference of 0.72%), and Seminole (4.1%, a difference of 0.80%).
| Demographics | Rating | Rank | Hearing Disability |
| Chippewa | 0.0 /100 | #319 | Tragic 4.0% |
| Shoshone | 0.0 /100 | #320 | Tragic 4.0% |
| Paiute | 0.0 /100 | #321 | Tragic 4.1% |
| Seminole | 0.0 /100 | #322 | Tragic 4.1% |
| Apache | 0.0 /100 | #323 | Tragic 4.1% |
| Osage | 0.0 /100 | #324 | Tragic 4.1% |
| Lumbee | 0.0 /100 | #325 | Tragic 4.1% |
| Potawatomi | 0.0 /100 | #326 | Tragic 4.1% |
| Arapaho | 0.0 /100 | #327 | Tragic 4.1% |
| Tohono O'odham | 0.0 /100 | #328 | Tragic 4.2% |
| Crow | 0.0 /100 | #329 | Tragic 4.2% |
| Natives/Alaskans | 0.0 /100 | #330 | Tragic 4.2% |
| Cherokee | 0.0 /100 | #331 | Tragic 4.2% |
| Houma | 0.0 /100 | #332 | Tragic 4.2% |
| Dutch West Indians | 0.0 /100 | #333 | Tragic 4.3% |
Demographics Similar to Scandinavians by Hearing Disability
In terms of hearing disability, the demographic groups most similar to Scandinavians are French American Indian (3.6%, a difference of 0.060%), Swedish (3.6%, a difference of 0.090%), Slovak (3.6%, a difference of 0.12%), Blackfeet (3.6%, a difference of 0.34%), and Basque (3.6%, a difference of 0.39%).
| Demographics | Rating | Rank | Hearing Disability |
| Swiss | 0.0 /100 | #274 | Tragic 3.5% |
| Czechoslovakians | 0.0 /100 | #275 | Tragic 3.6% |
| Danes | 0.0 /100 | #276 | Tragic 3.6% |
| Immigrants | Nonimmigrants | 0.0 /100 | #277 | Tragic 3.6% |
| Basques | 0.0 /100 | #278 | Tragic 3.6% |
| Slovaks | 0.0 /100 | #279 | Tragic 3.6% |
| French American Indians | 0.0 /100 | #280 | Tragic 3.6% |
| Scandinavians | 0.0 /100 | #281 | Tragic 3.6% |
| Swedes | 0.0 /100 | #282 | Tragic 3.6% |
| Blackfeet | 0.0 /100 | #283 | Tragic 3.6% |
| Immigrants | Micronesia | 0.0 /100 | #284 | Tragic 3.6% |
| Sioux | 0.0 /100 | #285 | Tragic 3.6% |
| Delaware | 0.0 /100 | #286 | Tragic 3.6% |
| Spanish | 0.0 /100 | #287 | Tragic 3.7% |
| Irish | 0.0 /100 | #288 | Tragic 3.7% |