Immigrants from Fiji vs Scandinavian Hearing Disability
COMPARE
Immigrants from Fiji
Scandinavian
Hearing Disability
Hearing Disability Comparison
Immigrants from Fiji
Scandinavians
2.9%
HEARING DISABILITY
67.1/ 100
METRIC RATING
160th/ 347
METRIC RANK
3.6%
HEARING DISABILITY
0.0/ 100
METRIC RATING
281st/ 347
METRIC RANK
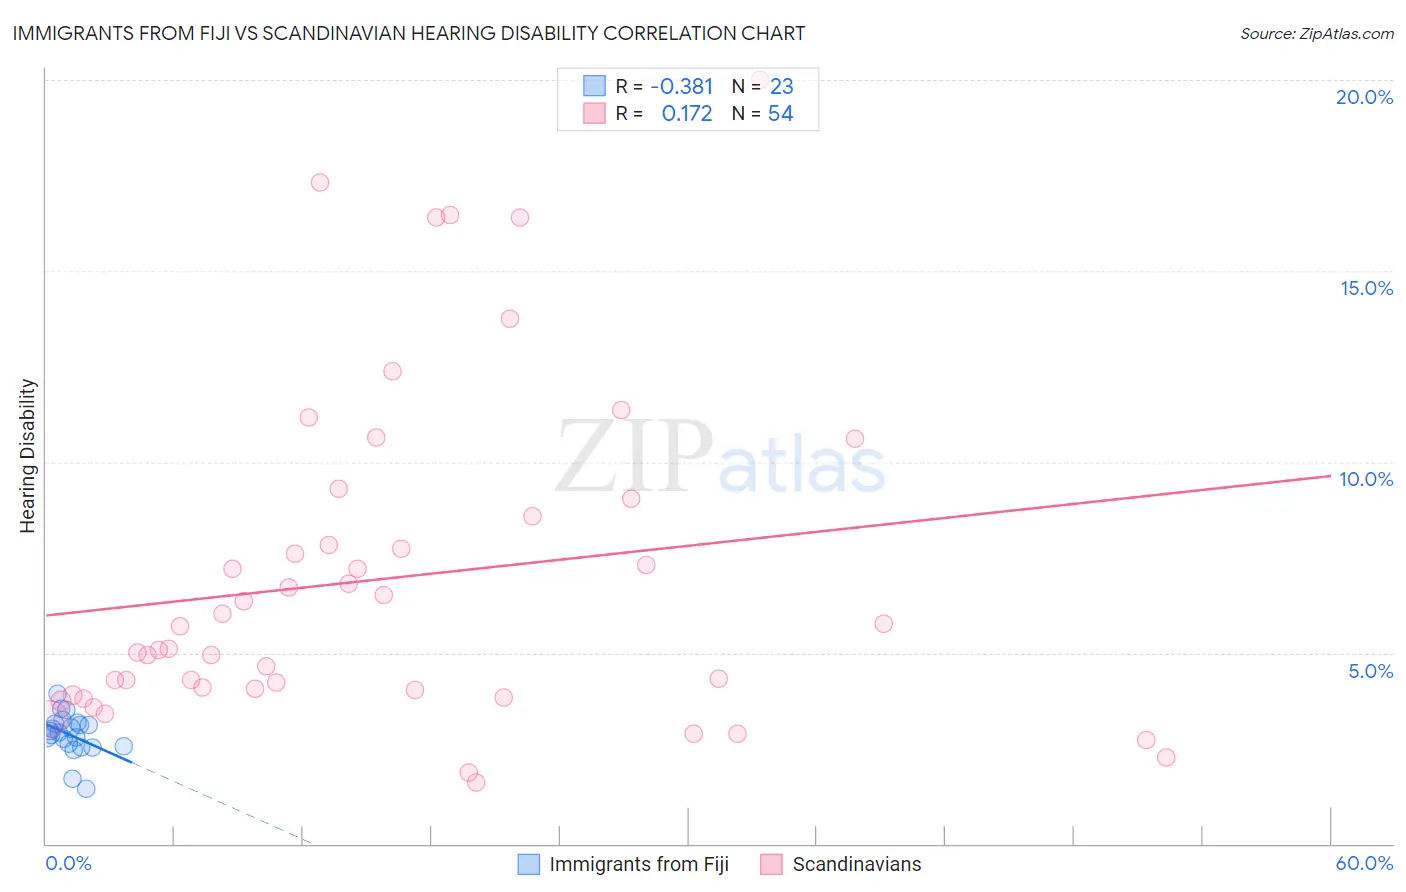
Immigrants from Fiji vs Scandinavian Hearing Disability Correlation Chart
The statistical analysis conducted on geographies consisting of 93,738,910 people shows a mild negative correlation between the proportion of Immigrants from Fiji and percentage of population with hearing disability in the United States with a correlation coefficient (R) of -0.381 and weighted average of 2.9%. Similarly, the statistical analysis conducted on geographies consisting of 472,380,661 people shows a poor positive correlation between the proportion of Scandinavians and percentage of population with hearing disability in the United States with a correlation coefficient (R) of 0.172 and weighted average of 3.6%, a difference of 22.5%.
Hearing Disability Correlation Summary
| Measurement | Immigrants from Fiji | Scandinavian |
| Minimum | 1.4% | 1.6% |
| Maximum | 3.9% | 20.0% |
| Range | 2.5% | 18.4% |
| Mean | 2.9% | 6.9% |
| Median | 2.9% | 5.4% |
| Interquartile 25% (IQ1) | 2.5% | 4.0% |
| Interquartile 75% (IQ3) | 3.2% | 8.6% |
| Interquartile Range (IQR) | 0.61% | 4.6% |
| Standard Deviation (Sample) | 0.54% | 4.3% |
| Standard Deviation (Population) | 0.53% | 4.3% |
Similar Demographics by Hearing Disability
Demographics Similar to Immigrants from Fiji by Hearing Disability
In terms of hearing disability, the demographic groups most similar to Immigrants from Fiji are Immigrants from Australia (2.9%, a difference of 0.020%), Albanian (2.9%, a difference of 0.060%), Immigrants from Japan (2.9%, a difference of 0.090%), Immigrants from Central America (3.0%, a difference of 0.24%), and Immigrants from Cambodia (3.0%, a difference of 0.25%).
| Demographics | Rating | Rank | Hearing Disability |
| Sudanese | 72.1 /100 | #153 | Good 2.9% |
| Immigrants | Lebanon | 71.5 /100 | #154 | Good 2.9% |
| Costa Ricans | 71.4 /100 | #155 | Good 2.9% |
| Immigrants | Poland | 70.2 /100 | #156 | Good 2.9% |
| Immigrants | Kazakhstan | 69.6 /100 | #157 | Good 2.9% |
| Immigrants | Burma/Myanmar | 69.5 /100 | #158 | Good 2.9% |
| Immigrants | Australia | 67.4 /100 | #159 | Good 2.9% |
| Immigrants | Fiji | 67.1 /100 | #160 | Good 2.9% |
| Albanians | 66.6 /100 | #161 | Good 2.9% |
| Immigrants | Japan | 66.3 /100 | #162 | Good 2.9% |
| Immigrants | Central America | 64.9 /100 | #163 | Good 3.0% |
| Immigrants | Cambodia | 64.8 /100 | #164 | Good 3.0% |
| Immigrants | Zimbabwe | 64.2 /100 | #165 | Good 3.0% |
| Immigrants | South Eastern Asia | 62.9 /100 | #166 | Good 3.0% |
| Immigrants | Eastern Europe | 58.1 /100 | #167 | Average 3.0% |
Demographics Similar to Scandinavians by Hearing Disability
In terms of hearing disability, the demographic groups most similar to Scandinavians are French American Indian (3.6%, a difference of 0.060%), Swedish (3.6%, a difference of 0.090%), Slovak (3.6%, a difference of 0.12%), Blackfeet (3.6%, a difference of 0.34%), and Basque (3.6%, a difference of 0.39%).
| Demographics | Rating | Rank | Hearing Disability |
| Swiss | 0.0 /100 | #274 | Tragic 3.5% |
| Czechoslovakians | 0.0 /100 | #275 | Tragic 3.6% |
| Danes | 0.0 /100 | #276 | Tragic 3.6% |
| Immigrants | Nonimmigrants | 0.0 /100 | #277 | Tragic 3.6% |
| Basques | 0.0 /100 | #278 | Tragic 3.6% |
| Slovaks | 0.0 /100 | #279 | Tragic 3.6% |
| French American Indians | 0.0 /100 | #280 | Tragic 3.6% |
| Scandinavians | 0.0 /100 | #281 | Tragic 3.6% |
| Swedes | 0.0 /100 | #282 | Tragic 3.6% |
| Blackfeet | 0.0 /100 | #283 | Tragic 3.6% |
| Immigrants | Micronesia | 0.0 /100 | #284 | Tragic 3.6% |
| Sioux | 0.0 /100 | #285 | Tragic 3.6% |
| Delaware | 0.0 /100 | #286 | Tragic 3.6% |
| Spanish | 0.0 /100 | #287 | Tragic 3.7% |
| Irish | 0.0 /100 | #288 | Tragic 3.7% |