Comanche vs Scandinavian Hearing Disability
COMPARE
Comanche
Scandinavian
Hearing Disability
Hearing Disability Comparison
Comanche
Scandinavians
4.0%
HEARING DISABILITY
0.0/ 100
METRIC RATING
317th/ 347
METRIC RANK
3.6%
HEARING DISABILITY
0.0/ 100
METRIC RATING
281st/ 347
METRIC RANK
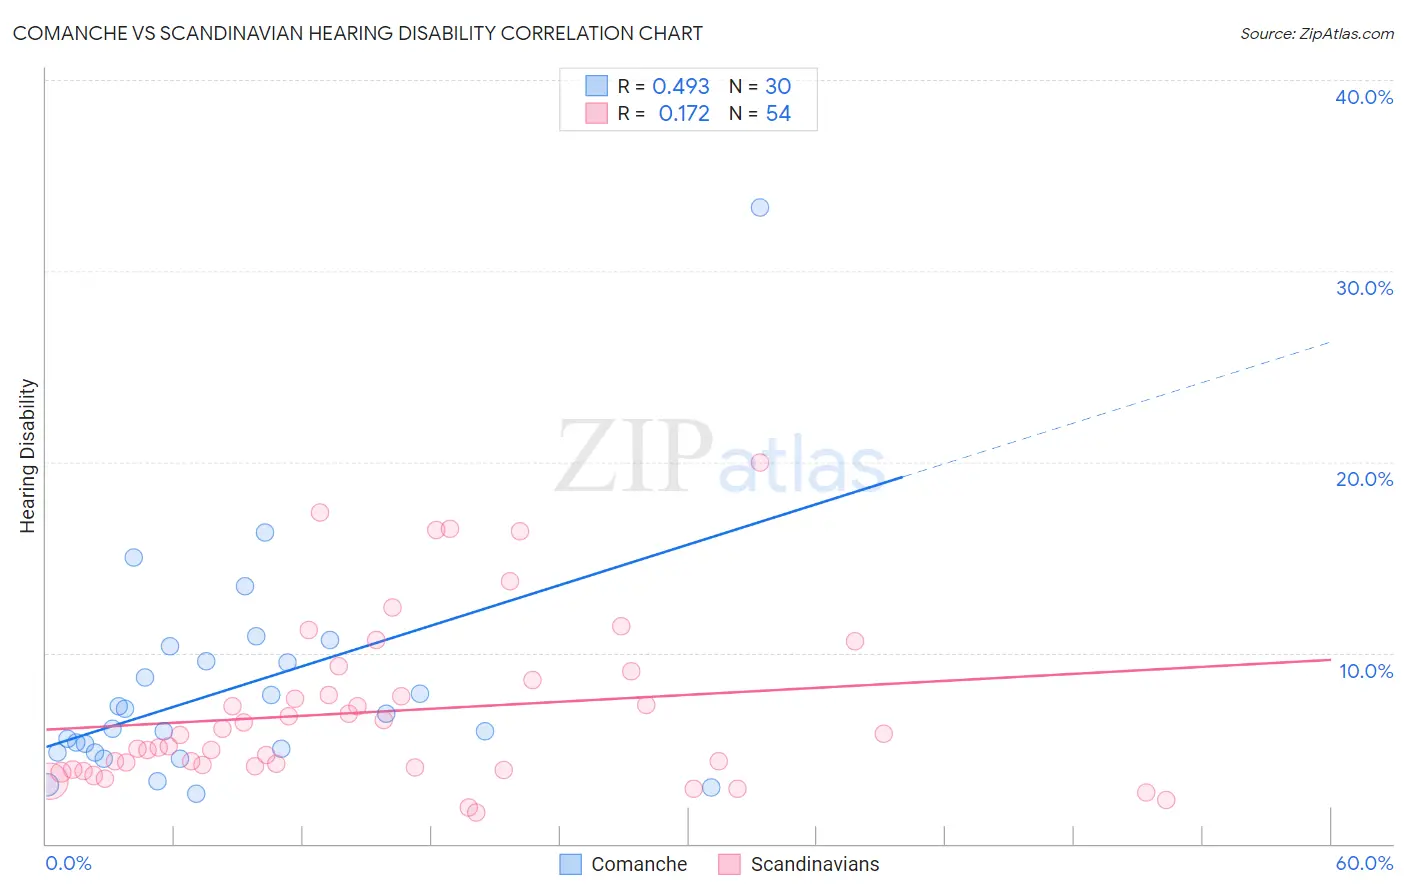
Comanche vs Scandinavian Hearing Disability Correlation Chart
The statistical analysis conducted on geographies consisting of 109,751,188 people shows a moderate positive correlation between the proportion of Comanche and percentage of population with hearing disability in the United States with a correlation coefficient (R) of 0.493 and weighted average of 4.0%. Similarly, the statistical analysis conducted on geographies consisting of 472,380,661 people shows a poor positive correlation between the proportion of Scandinavians and percentage of population with hearing disability in the United States with a correlation coefficient (R) of 0.172 and weighted average of 3.6%, a difference of 9.8%.
Hearing Disability Correlation Summary
| Measurement | Comanche | Scandinavian |
| Minimum | 2.6% | 1.6% |
| Maximum | 33.3% | 20.0% |
| Range | 30.7% | 18.4% |
| Mean | 8.1% | 6.9% |
| Median | 6.4% | 5.4% |
| Interquartile 25% (IQ1) | 4.8% | 4.0% |
| Interquartile 75% (IQ3) | 9.6% | 8.6% |
| Interquartile Range (IQR) | 4.8% | 4.6% |
| Standard Deviation (Sample) | 5.9% | 4.3% |
| Standard Deviation (Population) | 5.8% | 4.3% |
Similar Demographics by Hearing Disability
Demographics Similar to Comanche by Hearing Disability
In terms of hearing disability, the demographic groups most similar to Comanche are Spanish American (4.0%, a difference of 0.13%), Cheyenne (4.0%, a difference of 0.17%), Puget Sound Salish (3.9%, a difference of 0.33%), Yakama (3.9%, a difference of 0.34%), and Hopi (3.9%, a difference of 0.51%).
| Demographics | Rating | Rank | Hearing Disability |
| Cree | 0.0 /100 | #310 | Tragic 3.8% |
| Americans | 0.0 /100 | #311 | Tragic 3.9% |
| Cajuns | 0.0 /100 | #312 | Tragic 3.9% |
| Hopi | 0.0 /100 | #313 | Tragic 3.9% |
| Yakama | 0.0 /100 | #314 | Tragic 3.9% |
| Puget Sound Salish | 0.0 /100 | #315 | Tragic 3.9% |
| Spanish Americans | 0.0 /100 | #316 | Tragic 4.0% |
| Comanche | 0.0 /100 | #317 | Tragic 4.0% |
| Cheyenne | 0.0 /100 | #318 | Tragic 4.0% |
| Chippewa | 0.0 /100 | #319 | Tragic 4.0% |
| Shoshone | 0.0 /100 | #320 | Tragic 4.0% |
| Paiute | 0.0 /100 | #321 | Tragic 4.1% |
| Seminole | 0.0 /100 | #322 | Tragic 4.1% |
| Apache | 0.0 /100 | #323 | Tragic 4.1% |
| Osage | 0.0 /100 | #324 | Tragic 4.1% |
Demographics Similar to Scandinavians by Hearing Disability
In terms of hearing disability, the demographic groups most similar to Scandinavians are French American Indian (3.6%, a difference of 0.060%), Swedish (3.6%, a difference of 0.090%), Slovak (3.6%, a difference of 0.12%), Blackfeet (3.6%, a difference of 0.34%), and Basque (3.6%, a difference of 0.39%).
| Demographics | Rating | Rank | Hearing Disability |
| Swiss | 0.0 /100 | #274 | Tragic 3.5% |
| Czechoslovakians | 0.0 /100 | #275 | Tragic 3.6% |
| Danes | 0.0 /100 | #276 | Tragic 3.6% |
| Immigrants | Nonimmigrants | 0.0 /100 | #277 | Tragic 3.6% |
| Basques | 0.0 /100 | #278 | Tragic 3.6% |
| Slovaks | 0.0 /100 | #279 | Tragic 3.6% |
| French American Indians | 0.0 /100 | #280 | Tragic 3.6% |
| Scandinavians | 0.0 /100 | #281 | Tragic 3.6% |
| Swedes | 0.0 /100 | #282 | Tragic 3.6% |
| Blackfeet | 0.0 /100 | #283 | Tragic 3.6% |
| Immigrants | Micronesia | 0.0 /100 | #284 | Tragic 3.6% |
| Sioux | 0.0 /100 | #285 | Tragic 3.6% |
| Delaware | 0.0 /100 | #286 | Tragic 3.6% |
| Spanish | 0.0 /100 | #287 | Tragic 3.7% |
| Irish | 0.0 /100 | #288 | Tragic 3.7% |