Immigrants from Sudan vs Immigrants from Afghanistan Self-Care Disability
COMPARE
Immigrants from Sudan
Immigrants from Afghanistan
Self-Care Disability
Self-Care Disability Comparison
Immigrants from Sudan
Immigrants from Afghanistan
2.3%
SELF-CARE DISABILITY
99.8/ 100
METRIC RATING
41st/ 347
METRIC RANK
2.5%
SELF-CARE DISABILITY
47.6/ 100
METRIC RATING
176th/ 347
METRIC RANK
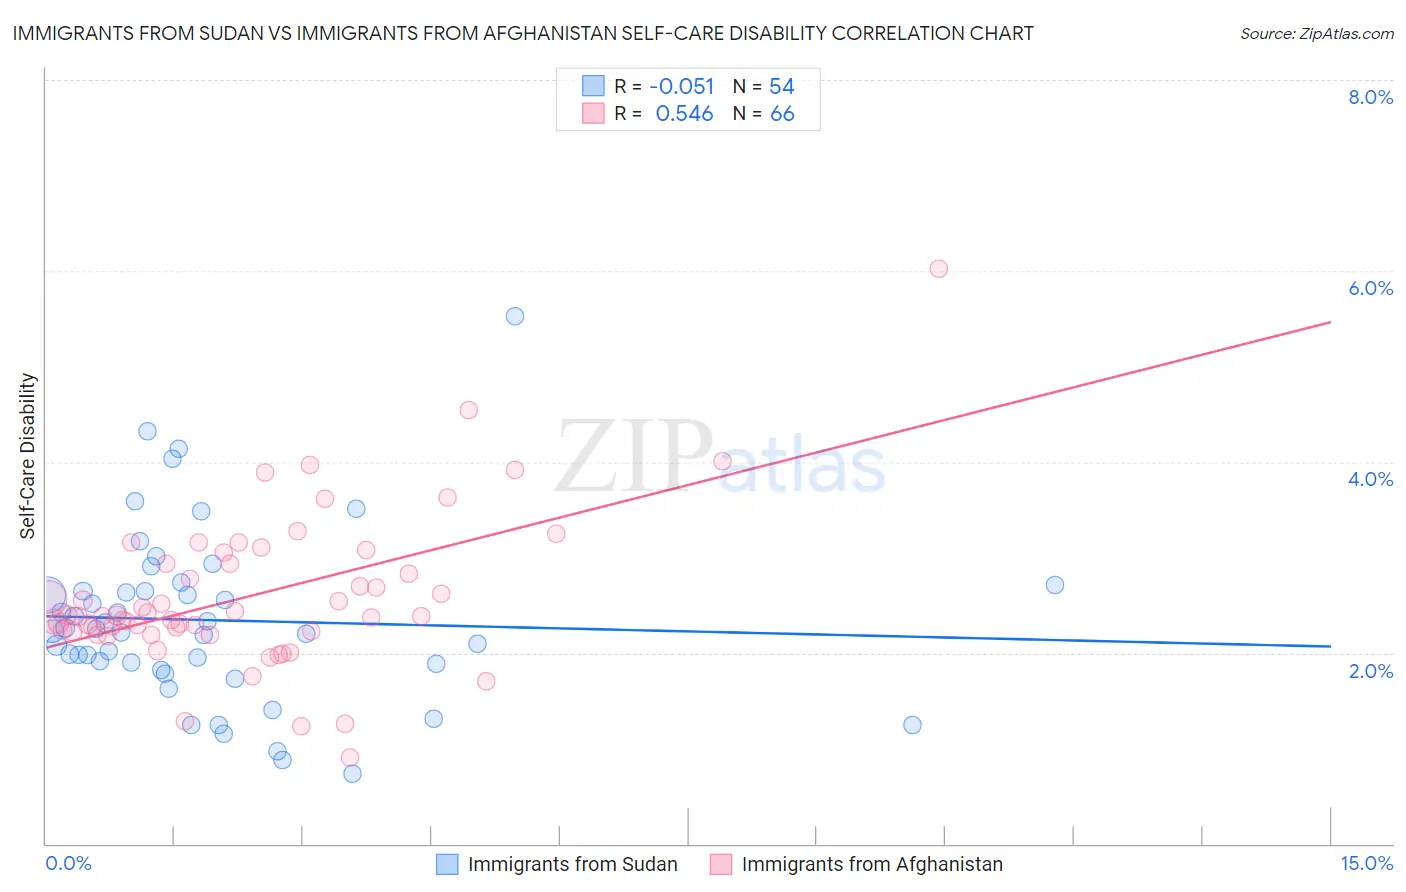
Immigrants from Sudan vs Immigrants from Afghanistan Self-Care Disability Correlation Chart
The statistical analysis conducted on geographies consisting of 118,937,078 people shows a slight negative correlation between the proportion of Immigrants from Sudan and percentage of population with self-care disability in the United States with a correlation coefficient (R) of -0.051 and weighted average of 2.3%. Similarly, the statistical analysis conducted on geographies consisting of 147,580,725 people shows a substantial positive correlation between the proportion of Immigrants from Afghanistan and percentage of population with self-care disability in the United States with a correlation coefficient (R) of 0.546 and weighted average of 2.5%, a difference of 8.3%.
Self-Care Disability Correlation Summary
| Measurement | Immigrants from Sudan | Immigrants from Afghanistan |
| Minimum | 0.73% | 0.91% |
| Maximum | 5.5% | 6.0% |
| Range | 4.8% | 5.1% |
| Mean | 2.3% | 2.6% |
| Median | 2.2% | 2.4% |
| Interquartile 25% (IQ1) | 1.9% | 2.2% |
| Interquartile 75% (IQ3) | 2.6% | 2.9% |
| Interquartile Range (IQR) | 0.77% | 0.71% |
| Standard Deviation (Sample) | 0.91% | 0.80% |
| Standard Deviation (Population) | 0.90% | 0.80% |
Similar Demographics by Self-Care Disability
Demographics Similar to Immigrants from Sudan by Self-Care Disability
In terms of self-care disability, the demographic groups most similar to Immigrants from Sudan are Iranian (2.3%, a difference of 0.070%), Immigrants from Uganda (2.3%, a difference of 0.10%), Immigrants from Bulgaria (2.3%, a difference of 0.11%), Immigrants from Pakistan (2.3%, a difference of 0.14%), and Immigrants from South Africa (2.3%, a difference of 0.19%).
| Demographics | Rating | Rank | Self-Care Disability |
| Immigrants | Turkey | 99.9 /100 | #34 | Exceptional 2.3% |
| Immigrants | Australia | 99.9 /100 | #35 | Exceptional 2.3% |
| Immigrants | Lithuania | 99.9 /100 | #36 | Exceptional 2.3% |
| Immigrants | Sweden | 99.9 /100 | #37 | Exceptional 2.3% |
| Immigrants | Eastern Africa | 99.9 /100 | #38 | Exceptional 2.3% |
| Immigrants | Bulgaria | 99.8 /100 | #39 | Exceptional 2.3% |
| Iranians | 99.8 /100 | #40 | Exceptional 2.3% |
| Immigrants | Sudan | 99.8 /100 | #41 | Exceptional 2.3% |
| Immigrants | Uganda | 99.8 /100 | #42 | Exceptional 2.3% |
| Immigrants | Pakistan | 99.8 /100 | #43 | Exceptional 2.3% |
| Immigrants | South Africa | 99.8 /100 | #44 | Exceptional 2.3% |
| Norwegians | 99.8 /100 | #45 | Exceptional 2.3% |
| Czechs | 99.8 /100 | #46 | Exceptional 2.3% |
| Jordanians | 99.7 /100 | #47 | Exceptional 2.3% |
| Immigrants | Malaysia | 99.7 /100 | #48 | Exceptional 2.3% |
Demographics Similar to Immigrants from Afghanistan by Self-Care Disability
In terms of self-care disability, the demographic groups most similar to Immigrants from Afghanistan are Immigrants from Kazakhstan (2.5%, a difference of 0.040%), English (2.5%, a difference of 0.070%), Immigrants from Bosnia and Herzegovina (2.5%, a difference of 0.090%), Hungarian (2.5%, a difference of 0.10%), and Welsh (2.5%, a difference of 0.11%).
| Demographics | Rating | Rank | Self-Care Disability |
| Immigrants | Somalia | 55.9 /100 | #169 | Average 2.5% |
| Scottish | 54.3 /100 | #170 | Average 2.5% |
| Pennsylvania Germans | 53.5 /100 | #171 | Average 2.5% |
| Czechoslovakians | 53.5 /100 | #172 | Average 2.5% |
| Immigrants | Burma/Myanmar | 52.8 /100 | #173 | Average 2.5% |
| Welsh | 50.0 /100 | #174 | Average 2.5% |
| Immigrants | Bosnia and Herzegovina | 49.6 /100 | #175 | Average 2.5% |
| Immigrants | Afghanistan | 47.6 /100 | #176 | Average 2.5% |
| Immigrants | Kazakhstan | 46.7 /100 | #177 | Average 2.5% |
| English | 46.2 /100 | #178 | Average 2.5% |
| Hungarians | 45.5 /100 | #179 | Average 2.5% |
| Indonesians | 41.2 /100 | #180 | Average 2.5% |
| Ghanaians | 40.4 /100 | #181 | Average 2.5% |
| Maltese | 37.5 /100 | #182 | Fair 2.5% |
| Salvadorans | 36.4 /100 | #183 | Fair 2.5% |