South African vs Immigrants from Sudan Female Disability
COMPARE
South African
Immigrants from Sudan
Female Disability
Female Disability Comparison
South Africans
Immigrants from Sudan
11.8%
FEMALE DISABILITY
97.7/ 100
METRIC RATING
114th/ 347
METRIC RANK
11.9%
FEMALE DISABILITY
89.6/ 100
METRIC RATING
143rd/ 347
METRIC RANK
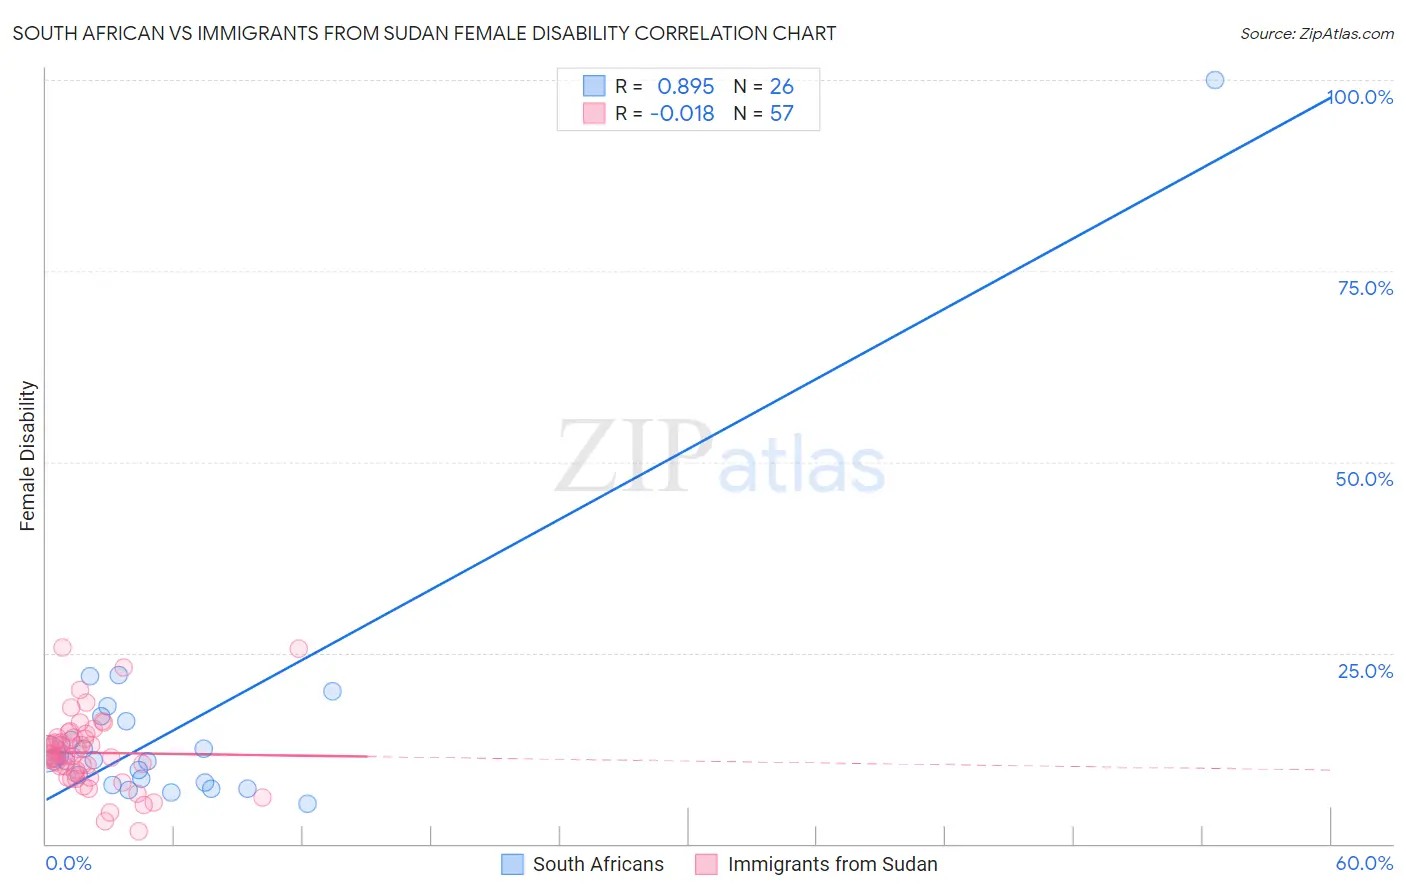
South African vs Immigrants from Sudan Female Disability Correlation Chart
The statistical analysis conducted on geographies consisting of 182,588,649 people shows a very strong positive correlation between the proportion of South Africans and percentage of females with a disability in the United States with a correlation coefficient (R) of 0.895 and weighted average of 11.8%. Similarly, the statistical analysis conducted on geographies consisting of 118,956,198 people shows no correlation between the proportion of Immigrants from Sudan and percentage of females with a disability in the United States with a correlation coefficient (R) of -0.018 and weighted average of 11.9%, a difference of 1.6%.
Female Disability Correlation Summary
| Measurement | South African | Immigrants from Sudan |
| Minimum | 5.3% | 1.7% |
| Maximum | 100.0% | 25.7% |
| Range | 94.7% | 24.0% |
| Mean | 15.3% | 11.9% |
| Median | 11.1% | 11.6% |
| Interquartile 25% (IQ1) | 8.1% | 9.0% |
| Interquartile 75% (IQ3) | 16.1% | 13.9% |
| Interquartile Range (IQR) | 8.0% | 4.9% |
| Standard Deviation (Sample) | 17.9% | 4.8% |
| Standard Deviation (Population) | 17.6% | 4.7% |
Similar Demographics by Female Disability
Demographics Similar to South Africans by Female Disability
In terms of female disability, the demographic groups most similar to South Africans are Brazilian (11.8%, a difference of 0.0%), Immigrants from Belarus (11.8%, a difference of 0.030%), Immigrants from Bangladesh (11.8%, a difference of 0.040%), Immigrants from Morocco (11.8%, a difference of 0.050%), and Costa Rican (11.7%, a difference of 0.16%).
| Demographics | Rating | Rank | Female Disability |
| Latvians | 98.2 /100 | #107 | Exceptional 11.7% |
| New Zealanders | 98.1 /100 | #108 | Exceptional 11.7% |
| Immigrants | Immigrants | 98.1 /100 | #109 | Exceptional 11.7% |
| Soviet Union | 98.1 /100 | #110 | Exceptional 11.7% |
| Costa Ricans | 98.1 /100 | #111 | Exceptional 11.7% |
| Immigrants | Bangladesh | 97.8 /100 | #112 | Exceptional 11.8% |
| Immigrants | Belarus | 97.8 /100 | #113 | Exceptional 11.8% |
| South Africans | 97.7 /100 | #114 | Exceptional 11.8% |
| Brazilians | 97.7 /100 | #115 | Exceptional 11.8% |
| Immigrants | Morocco | 97.6 /100 | #116 | Exceptional 11.8% |
| Immigrants | Eastern Europe | 97.2 /100 | #117 | Exceptional 11.8% |
| Immigrants | Nigeria | 97.2 /100 | #118 | Exceptional 11.8% |
| Immigrants | Uganda | 97.2 /100 | #119 | Exceptional 11.8% |
| Immigrants | Kazakhstan | 97.0 /100 | #120 | Exceptional 11.8% |
| Immigrants | Netherlands | 96.9 /100 | #121 | Exceptional 11.8% |
Demographics Similar to Immigrants from Sudan by Female Disability
In terms of female disability, the demographic groups most similar to Immigrants from Sudan are Immigrants from Africa (11.9%, a difference of 0.040%), Immigrants from Austria (12.0%, a difference of 0.17%), Estonian (12.0%, a difference of 0.17%), Immigrants from Ecuador (11.9%, a difference of 0.21%), and Romanian (11.9%, a difference of 0.23%).
| Demographics | Rating | Rank | Female Disability |
| Ugandans | 94.0 /100 | #136 | Exceptional 11.9% |
| Immigrants | Norway | 93.8 /100 | #137 | Exceptional 11.9% |
| Ecuadorians | 93.4 /100 | #138 | Exceptional 11.9% |
| Immigrants | Hungary | 92.8 /100 | #139 | Exceptional 11.9% |
| Romanians | 91.6 /100 | #140 | Exceptional 11.9% |
| Immigrants | Ecuador | 91.5 /100 | #141 | Exceptional 11.9% |
| Immigrants | Africa | 90.0 /100 | #142 | Excellent 11.9% |
| Immigrants | Sudan | 89.6 /100 | #143 | Excellent 11.9% |
| Immigrants | Austria | 87.9 /100 | #144 | Excellent 12.0% |
| Estonians | 87.8 /100 | #145 | Excellent 12.0% |
| Pakistanis | 84.6 /100 | #146 | Excellent 12.0% |
| Nigerians | 84.0 /100 | #147 | Excellent 12.0% |
| Immigrants | Kenya | 83.1 /100 | #148 | Excellent 12.0% |
| Greeks | 82.0 /100 | #149 | Excellent 12.0% |
| Immigrants | Moldova | 81.4 /100 | #150 | Excellent 12.0% |