Norwegian vs Immigrants from Sudan Female Disability
COMPARE
Norwegian
Immigrants from Sudan
Female Disability
Female Disability Comparison
Norwegians
Immigrants from Sudan
12.3%
FEMALE DISABILITY
36.9/ 100
METRIC RATING
182nd/ 347
METRIC RANK
11.9%
FEMALE DISABILITY
89.6/ 100
METRIC RATING
143rd/ 347
METRIC RANK
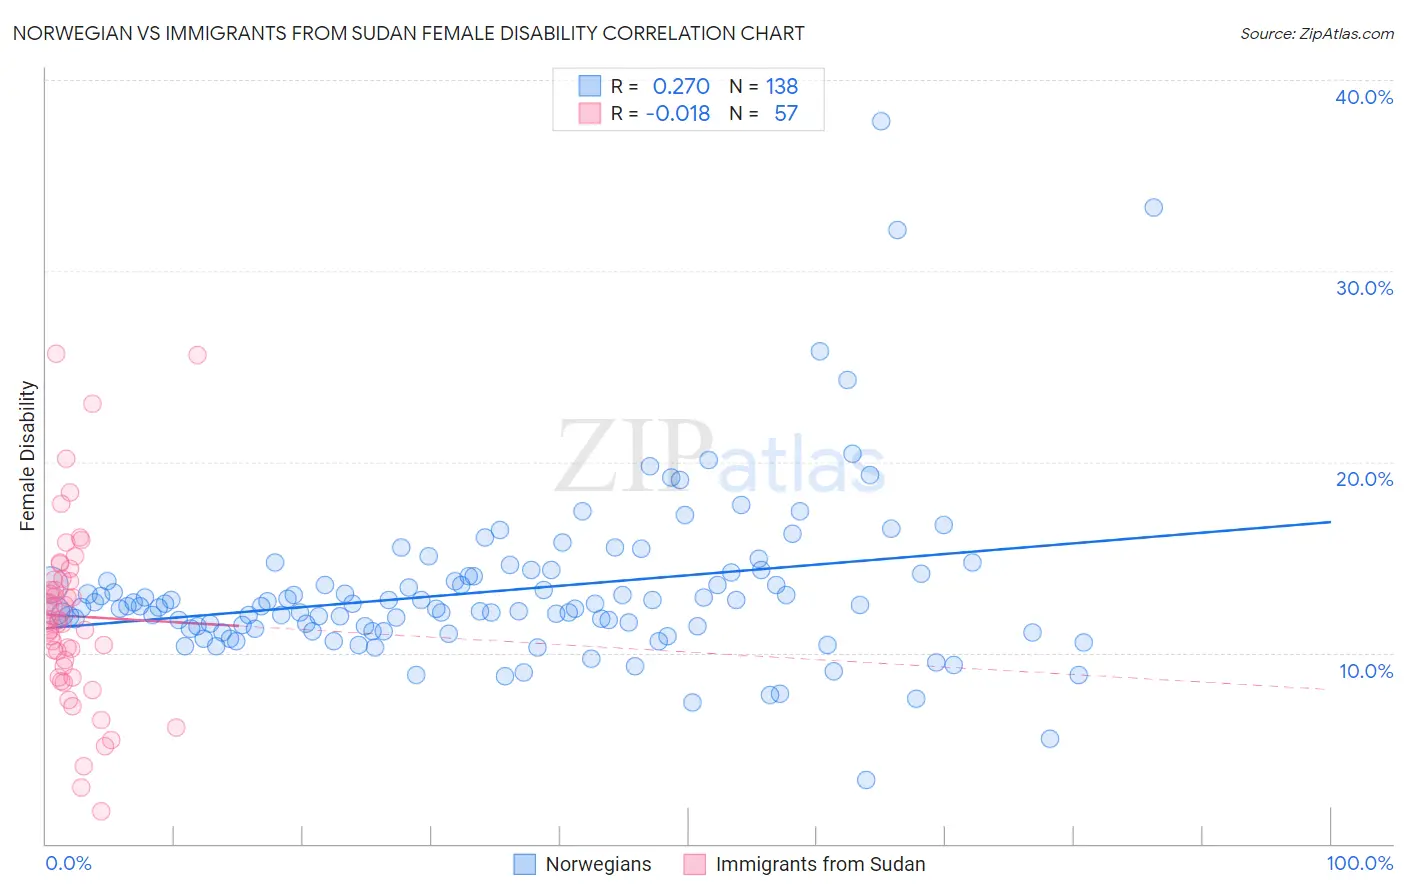
Norwegian vs Immigrants from Sudan Female Disability Correlation Chart
The statistical analysis conducted on geographies consisting of 533,161,663 people shows a weak positive correlation between the proportion of Norwegians and percentage of females with a disability in the United States with a correlation coefficient (R) of 0.270 and weighted average of 12.3%. Similarly, the statistical analysis conducted on geographies consisting of 118,956,198 people shows no correlation between the proportion of Immigrants from Sudan and percentage of females with a disability in the United States with a correlation coefficient (R) of -0.018 and weighted average of 11.9%, a difference of 2.6%.
Female Disability Correlation Summary
| Measurement | Norwegian | Immigrants from Sudan |
| Minimum | 3.3% | 1.7% |
| Maximum | 37.8% | 25.7% |
| Range | 34.5% | 24.0% |
| Mean | 13.3% | 11.9% |
| Median | 12.4% | 11.6% |
| Interquartile 25% (IQ1) | 11.3% | 9.0% |
| Interquartile 75% (IQ3) | 14.0% | 13.9% |
| Interquartile Range (IQR) | 2.8% | 4.9% |
| Standard Deviation (Sample) | 4.4% | 4.8% |
| Standard Deviation (Population) | 4.4% | 4.7% |
Similar Demographics by Female Disability
Demographics Similar to Norwegians by Female Disability
In terms of female disability, the demographic groups most similar to Norwegians are Immigrants from Canada (12.3%, a difference of 0.010%), Cuban (12.3%, a difference of 0.020%), Albanian (12.3%, a difference of 0.040%), Iraqi (12.3%, a difference of 0.040%), and Immigrants from Fiji (12.3%, a difference of 0.050%).
| Demographics | Rating | Rank | Female Disability |
| Immigrants | St. Vincent and the Grenadines | 49.7 /100 | #175 | Average 12.2% |
| Immigrants | Guyana | 43.1 /100 | #176 | Average 12.2% |
| Immigrants | Ghana | 42.5 /100 | #177 | Average 12.2% |
| Immigrants | Western Europe | 40.9 /100 | #178 | Average 12.2% |
| Immigrants | Fiji | 38.2 /100 | #179 | Fair 12.3% |
| Albanians | 37.9 /100 | #180 | Fair 12.3% |
| Immigrants | Canada | 37.2 /100 | #181 | Fair 12.3% |
| Norwegians | 36.9 /100 | #182 | Fair 12.3% |
| Cubans | 36.5 /100 | #183 | Fair 12.3% |
| Iraqis | 36.0 /100 | #184 | Fair 12.3% |
| Immigrants | Uzbekistan | 33.9 /100 | #185 | Fair 12.3% |
| Austrians | 33.3 /100 | #186 | Fair 12.3% |
| Serbians | 33.1 /100 | #187 | Fair 12.3% |
| Immigrants | North America | 32.8 /100 | #188 | Fair 12.3% |
| Immigrants | Albania | 31.6 /100 | #189 | Fair 12.3% |
Demographics Similar to Immigrants from Sudan by Female Disability
In terms of female disability, the demographic groups most similar to Immigrants from Sudan are Immigrants from Africa (11.9%, a difference of 0.040%), Immigrants from Austria (12.0%, a difference of 0.17%), Estonian (12.0%, a difference of 0.17%), Immigrants from Ecuador (11.9%, a difference of 0.21%), and Romanian (11.9%, a difference of 0.23%).
| Demographics | Rating | Rank | Female Disability |
| Ugandans | 94.0 /100 | #136 | Exceptional 11.9% |
| Immigrants | Norway | 93.8 /100 | #137 | Exceptional 11.9% |
| Ecuadorians | 93.4 /100 | #138 | Exceptional 11.9% |
| Immigrants | Hungary | 92.8 /100 | #139 | Exceptional 11.9% |
| Romanians | 91.6 /100 | #140 | Exceptional 11.9% |
| Immigrants | Ecuador | 91.5 /100 | #141 | Exceptional 11.9% |
| Immigrants | Africa | 90.0 /100 | #142 | Excellent 11.9% |
| Immigrants | Sudan | 89.6 /100 | #143 | Excellent 11.9% |
| Immigrants | Austria | 87.9 /100 | #144 | Excellent 12.0% |
| Estonians | 87.8 /100 | #145 | Excellent 12.0% |
| Pakistanis | 84.6 /100 | #146 | Excellent 12.0% |
| Nigerians | 84.0 /100 | #147 | Excellent 12.0% |
| Immigrants | Kenya | 83.1 /100 | #148 | Excellent 12.0% |
| Greeks | 82.0 /100 | #149 | Excellent 12.0% |
| Immigrants | Moldova | 81.4 /100 | #150 | Excellent 12.0% |