South African vs Immigrants from Sudan Single Mother Households
COMPARE
South African
Immigrants from Sudan
Single Mother Households
Single Mother Households Comparison
South Africans
Immigrants from Sudan
5.8%
SINGLE MOTHER HOUSEHOLDS
94.1/ 100
METRIC RATING
119th/ 347
METRIC RANK
6.9%
SINGLE MOTHER HOUSEHOLDS
3.5/ 100
METRIC RATING
224th/ 347
METRIC RANK
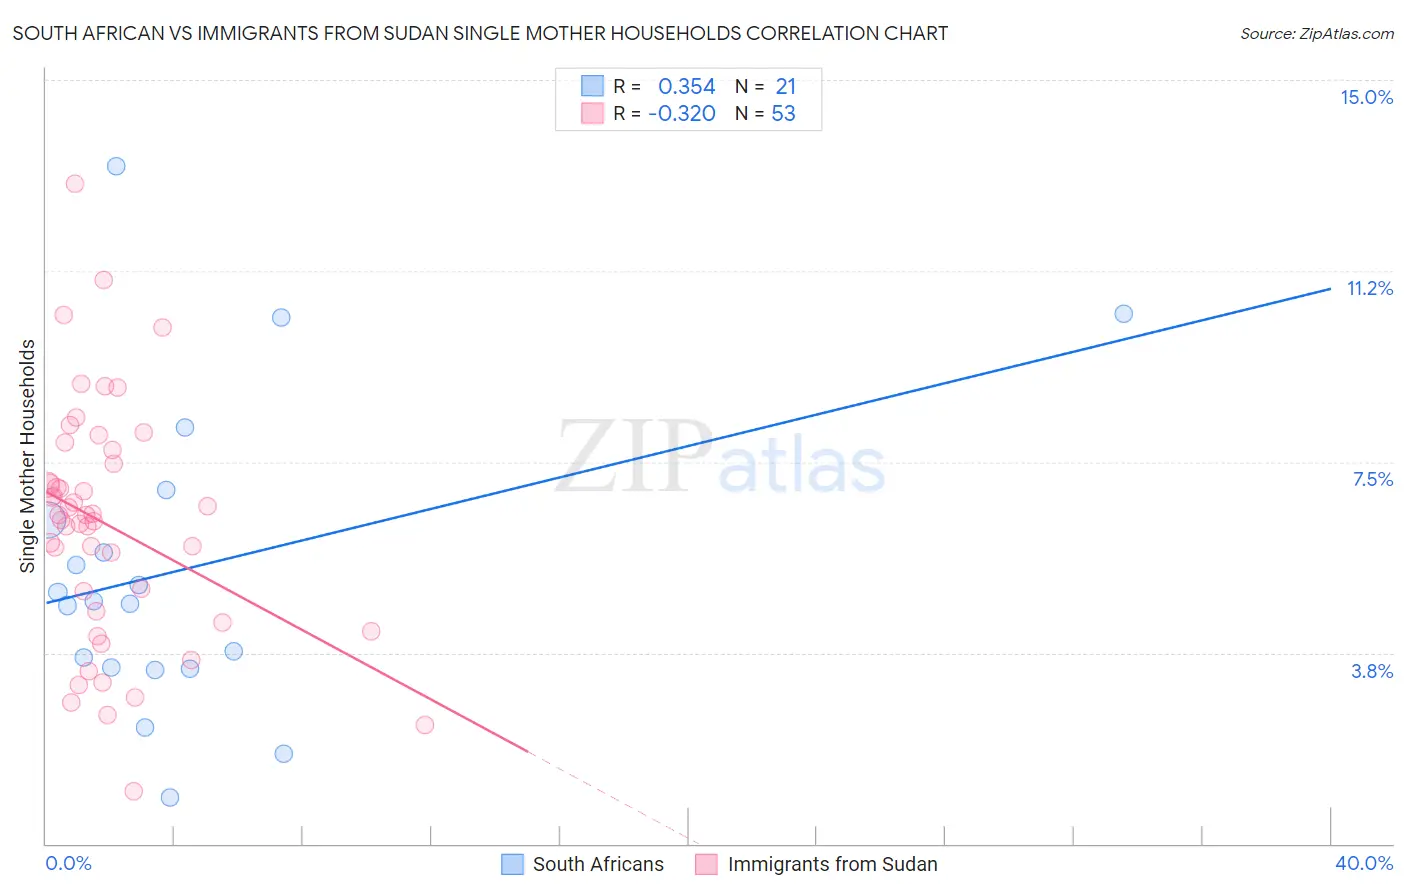
South African vs Immigrants from Sudan Single Mother Households Correlation Chart
The statistical analysis conducted on geographies consisting of 182,301,498 people shows a mild positive correlation between the proportion of South Africans and percentage of single mother households in the United States with a correlation coefficient (R) of 0.354 and weighted average of 5.8%. Similarly, the statistical analysis conducted on geographies consisting of 118,904,005 people shows a mild negative correlation between the proportion of Immigrants from Sudan and percentage of single mother households in the United States with a correlation coefficient (R) of -0.320 and weighted average of 6.9%, a difference of 18.0%.
Single Mother Households Correlation Summary
| Measurement | South African | Immigrants from Sudan |
| Minimum | 0.92% | 1.0% |
| Maximum | 13.3% | 13.0% |
| Range | 12.4% | 11.9% |
| Mean | 5.4% | 6.3% |
| Median | 4.8% | 6.5% |
| Interquartile 25% (IQ1) | 3.5% | 4.5% |
| Interquartile 75% (IQ3) | 6.7% | 7.6% |
| Interquartile Range (IQR) | 3.2% | 3.1% |
| Standard Deviation (Sample) | 3.0% | 2.4% |
| Standard Deviation (Population) | 3.0% | 2.3% |
Similar Demographics by Single Mother Households
Demographics Similar to South Africans by Single Mother Households
In terms of single mother households, the demographic groups most similar to South Africans are Laotian (5.8%, a difference of 0.11%), Tongan (5.8%, a difference of 0.19%), Argentinean (5.8%, a difference of 0.22%), Bolivian (5.8%, a difference of 0.28%), and Belgian (5.8%, a difference of 0.30%).
| Demographics | Rating | Rank | Single Mother Households |
| Immigrants | Kuwait | 95.4 /100 | #112 | Exceptional 5.8% |
| Mongolians | 95.3 /100 | #113 | Exceptional 5.8% |
| Dutch | 95.1 /100 | #114 | Exceptional 5.8% |
| Irish | 94.8 /100 | #115 | Exceptional 5.8% |
| Pennsylvania Germans | 94.7 /100 | #116 | Exceptional 5.8% |
| Bolivians | 94.6 /100 | #117 | Exceptional 5.8% |
| Laotians | 94.3 /100 | #118 | Exceptional 5.8% |
| South Africans | 94.1 /100 | #119 | Exceptional 5.8% |
| Tongans | 93.7 /100 | #120 | Exceptional 5.8% |
| Argentineans | 93.7 /100 | #121 | Exceptional 5.8% |
| Belgians | 93.5 /100 | #122 | Exceptional 5.8% |
| Immigrants | Uzbekistan | 93.4 /100 | #123 | Exceptional 5.9% |
| Immigrants | Argentina | 93.2 /100 | #124 | Exceptional 5.9% |
| Slavs | 92.9 /100 | #125 | Exceptional 5.9% |
| Welsh | 92.8 /100 | #126 | Exceptional 5.9% |
Demographics Similar to Immigrants from Sudan by Single Mother Households
In terms of single mother households, the demographic groups most similar to Immigrants from Sudan are Immigrants from Micronesia (6.9%, a difference of 0.12%), Immigrants from Bangladesh (6.9%, a difference of 0.17%), French American Indian (6.9%, a difference of 0.19%), Sudanese (6.9%, a difference of 0.27%), and Immigrants from Thailand (6.9%, a difference of 0.39%).
| Demographics | Rating | Rank | Single Mother Households |
| Aleuts | 4.8 /100 | #217 | Tragic 6.8% |
| Immigrants | Eastern Africa | 4.4 /100 | #218 | Tragic 6.8% |
| Immigrants | Immigrants | 4.3 /100 | #219 | Tragic 6.8% |
| Immigrants | Thailand | 4.0 /100 | #220 | Tragic 6.9% |
| French American Indians | 3.7 /100 | #221 | Tragic 6.9% |
| Immigrants | Bangladesh | 3.7 /100 | #222 | Tragic 6.9% |
| Immigrants | Micronesia | 3.6 /100 | #223 | Tragic 6.9% |
| Immigrants | Sudan | 3.5 /100 | #224 | Tragic 6.9% |
| Sudanese | 3.1 /100 | #225 | Tragic 6.9% |
| Paiute | 2.4 /100 | #226 | Tragic 7.0% |
| Kenyans | 2.3 /100 | #227 | Tragic 7.0% |
| Iroquois | 2.2 /100 | #228 | Tragic 7.0% |
| Immigrants | Kenya | 2.1 /100 | #229 | Tragic 7.0% |
| Creek | 1.6 /100 | #230 | Tragic 7.0% |
| Spanish Americans | 1.6 /100 | #231 | Tragic 7.0% |