Czech vs Immigrants from Sudan Female Disability
COMPARE
Czech
Immigrants from Sudan
Female Disability
Female Disability Comparison
Czechs
Immigrants from Sudan
12.1%
FEMALE DISABILITY
63.6/ 100
METRIC RATING
164th/ 347
METRIC RANK
11.9%
FEMALE DISABILITY
89.6/ 100
METRIC RATING
143rd/ 347
METRIC RANK
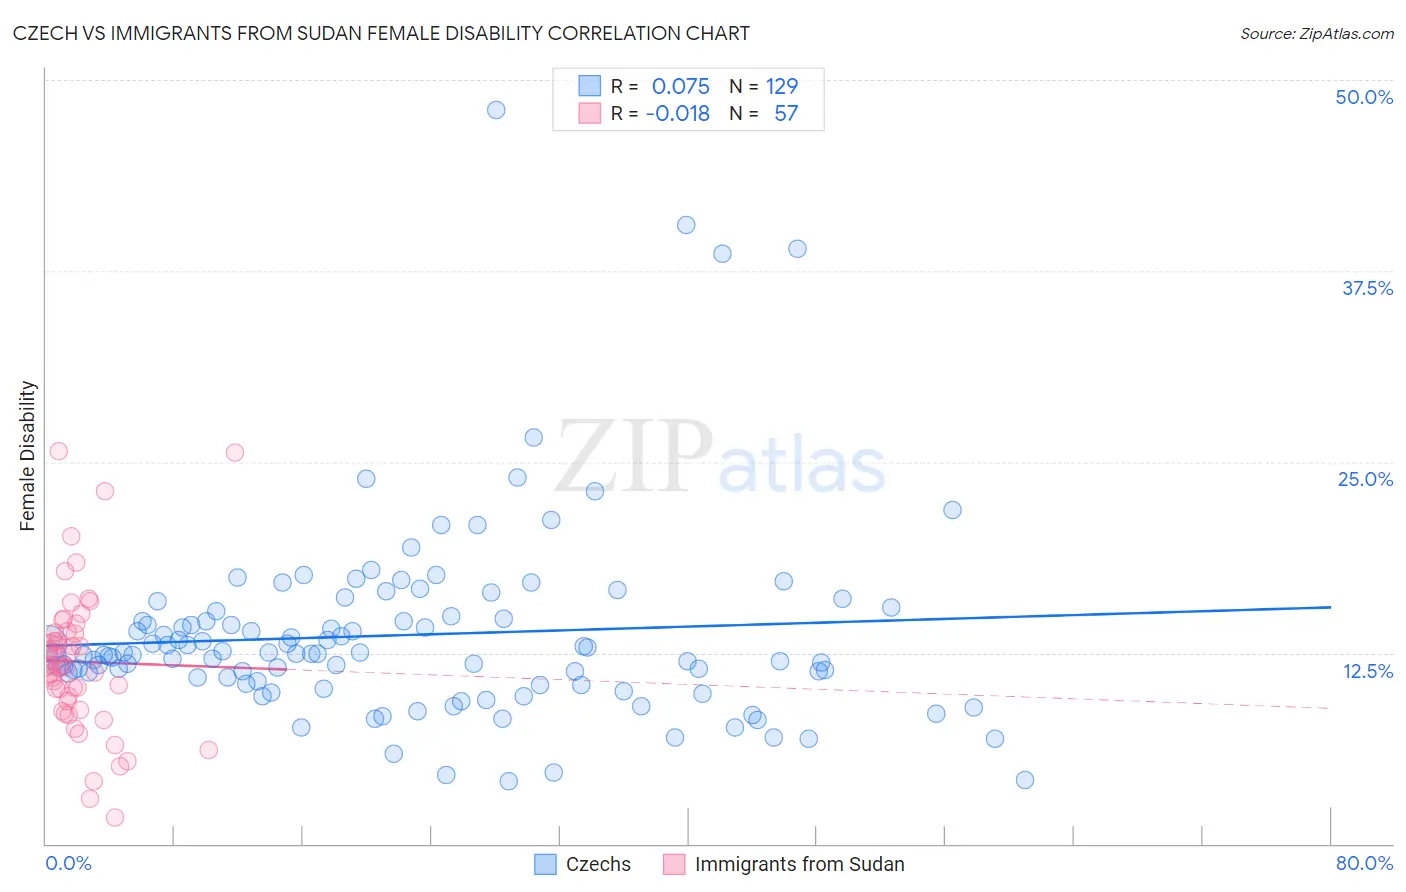
Czech vs Immigrants from Sudan Female Disability Correlation Chart
The statistical analysis conducted on geographies consisting of 484,697,758 people shows a slight positive correlation between the proportion of Czechs and percentage of females with a disability in the United States with a correlation coefficient (R) of 0.075 and weighted average of 12.1%. Similarly, the statistical analysis conducted on geographies consisting of 118,956,198 people shows no correlation between the proportion of Immigrants from Sudan and percentage of females with a disability in the United States with a correlation coefficient (R) of -0.018 and weighted average of 11.9%, a difference of 1.5%.
Female Disability Correlation Summary
| Measurement | Czech | Immigrants from Sudan |
| Minimum | 4.1% | 1.7% |
| Maximum | 48.0% | 25.7% |
| Range | 43.9% | 24.0% |
| Mean | 13.7% | 11.9% |
| Median | 12.5% | 11.6% |
| Interquartile 25% (IQ1) | 10.6% | 9.0% |
| Interquartile 75% (IQ3) | 14.8% | 13.9% |
| Interquartile Range (IQR) | 4.3% | 4.9% |
| Standard Deviation (Sample) | 6.4% | 4.8% |
| Standard Deviation (Population) | 6.4% | 4.7% |
Similar Demographics by Female Disability
Demographics Similar to Czechs by Female Disability
In terms of female disability, the demographic groups most similar to Czechs are Guatemalan (12.1%, a difference of 0.010%), Immigrants from Ukraine (12.1%, a difference of 0.030%), Guyanese (12.1%, a difference of 0.040%), Immigrants from Oceania (12.1%, a difference of 0.070%), and Immigrants from Guatemala (12.1%, a difference of 0.10%).
| Demographics | Rating | Rank | Female Disability |
| Danes | 72.5 /100 | #157 | Good 12.1% |
| Immigrants | Middle Africa | 72.4 /100 | #158 | Good 12.1% |
| Immigrants | Central America | 67.7 /100 | #159 | Good 12.1% |
| Immigrants | Guatemala | 66.0 /100 | #160 | Good 12.1% |
| Guyanese | 64.7 /100 | #161 | Good 12.1% |
| Immigrants | Ukraine | 64.3 /100 | #162 | Good 12.1% |
| Guatemalans | 63.8 /100 | #163 | Good 12.1% |
| Czechs | 63.6 /100 | #164 | Good 12.1% |
| Immigrants | Oceania | 61.8 /100 | #165 | Good 12.1% |
| Lithuanians | 59.5 /100 | #166 | Average 12.2% |
| Immigrants | Latin America | 59.0 /100 | #167 | Average 12.2% |
| Immigrants | Haiti | 58.8 /100 | #168 | Average 12.2% |
| Lebanese | 58.1 /100 | #169 | Average 12.2% |
| Maltese | 57.0 /100 | #170 | Average 12.2% |
| Immigrants | Southern Europe | 56.3 /100 | #171 | Average 12.2% |
Demographics Similar to Immigrants from Sudan by Female Disability
In terms of female disability, the demographic groups most similar to Immigrants from Sudan are Immigrants from Africa (11.9%, a difference of 0.040%), Immigrants from Austria (12.0%, a difference of 0.17%), Estonian (12.0%, a difference of 0.17%), Immigrants from Ecuador (11.9%, a difference of 0.21%), and Romanian (11.9%, a difference of 0.23%).
| Demographics | Rating | Rank | Female Disability |
| Ugandans | 94.0 /100 | #136 | Exceptional 11.9% |
| Immigrants | Norway | 93.8 /100 | #137 | Exceptional 11.9% |
| Ecuadorians | 93.4 /100 | #138 | Exceptional 11.9% |
| Immigrants | Hungary | 92.8 /100 | #139 | Exceptional 11.9% |
| Romanians | 91.6 /100 | #140 | Exceptional 11.9% |
| Immigrants | Ecuador | 91.5 /100 | #141 | Exceptional 11.9% |
| Immigrants | Africa | 90.0 /100 | #142 | Excellent 11.9% |
| Immigrants | Sudan | 89.6 /100 | #143 | Excellent 11.9% |
| Immigrants | Austria | 87.9 /100 | #144 | Excellent 12.0% |
| Estonians | 87.8 /100 | #145 | Excellent 12.0% |
| Pakistanis | 84.6 /100 | #146 | Excellent 12.0% |
| Nigerians | 84.0 /100 | #147 | Excellent 12.0% |
| Immigrants | Kenya | 83.1 /100 | #148 | Excellent 12.0% |
| Greeks | 82.0 /100 | #149 | Excellent 12.0% |
| Immigrants | Moldova | 81.4 /100 | #150 | Excellent 12.0% |