Bahamian vs Immigrants from Sudan Female Disability
COMPARE
Bahamian
Immigrants from Sudan
Female Disability
Female Disability Comparison
Bahamians
Immigrants from Sudan
12.4%
FEMALE DISABILITY
11.1/ 100
METRIC RATING
220th/ 347
METRIC RANK
11.9%
FEMALE DISABILITY
89.6/ 100
METRIC RATING
143rd/ 347
METRIC RANK
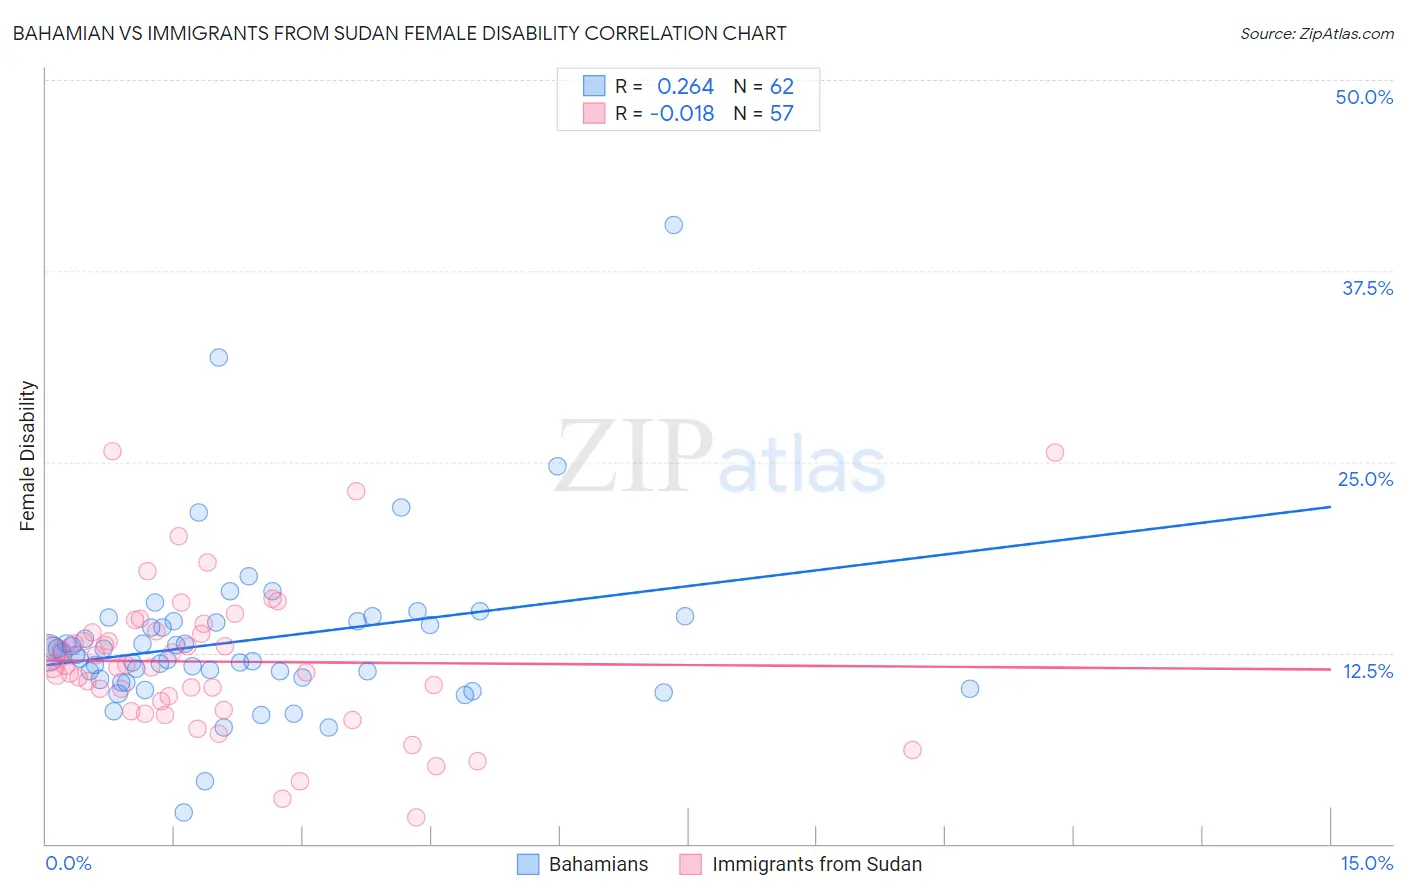
Bahamian vs Immigrants from Sudan Female Disability Correlation Chart
The statistical analysis conducted on geographies consisting of 112,675,688 people shows a weak positive correlation between the proportion of Bahamians and percentage of females with a disability in the United States with a correlation coefficient (R) of 0.264 and weighted average of 12.4%. Similarly, the statistical analysis conducted on geographies consisting of 118,956,198 people shows no correlation between the proportion of Immigrants from Sudan and percentage of females with a disability in the United States with a correlation coefficient (R) of -0.018 and weighted average of 11.9%, a difference of 4.1%.
Female Disability Correlation Summary
| Measurement | Bahamian | Immigrants from Sudan |
| Minimum | 2.1% | 1.7% |
| Maximum | 40.5% | 25.7% |
| Range | 38.4% | 24.0% |
| Mean | 13.3% | 11.9% |
| Median | 12.4% | 11.6% |
| Interquartile 25% (IQ1) | 10.8% | 9.0% |
| Interquartile 75% (IQ3) | 14.5% | 13.9% |
| Interquartile Range (IQR) | 3.8% | 4.9% |
| Standard Deviation (Sample) | 5.6% | 4.8% |
| Standard Deviation (Population) | 5.5% | 4.7% |
Similar Demographics by Female Disability
Demographics Similar to Bahamians by Female Disability
In terms of female disability, the demographic groups most similar to Bahamians are Native Hawaiian (12.4%, a difference of 0.030%), Italian (12.4%, a difference of 0.040%), European (12.4%, a difference of 0.090%), Immigrants from Bahamas (12.4%, a difference of 0.12%), and British (12.4%, a difference of 0.14%).
| Demographics | Rating | Rank | Female Disability |
| Immigrants | Thailand | 14.5 /100 | #213 | Poor 12.4% |
| Panamanians | 13.5 /100 | #214 | Poor 12.4% |
| Samoans | 13.4 /100 | #215 | Poor 12.4% |
| Immigrants | Burma/Myanmar | 13.3 /100 | #216 | Poor 12.4% |
| British | 12.7 /100 | #217 | Poor 12.4% |
| Immigrants | Bahamas | 12.5 /100 | #218 | Poor 12.4% |
| Europeans | 12.1 /100 | #219 | Poor 12.4% |
| Bahamians | 11.1 /100 | #220 | Poor 12.4% |
| Native Hawaiians | 10.8 /100 | #221 | Poor 12.4% |
| Italians | 10.7 /100 | #222 | Poor 12.4% |
| Guamanians/Chamorros | 9.5 /100 | #223 | Tragic 12.5% |
| Belizeans | 9.3 /100 | #224 | Tragic 12.5% |
| Poles | 8.4 /100 | #225 | Tragic 12.5% |
| Hispanics or Latinos | 8.0 /100 | #226 | Tragic 12.5% |
| Assyrians/Chaldeans/Syriacs | 8.0 /100 | #227 | Tragic 12.5% |
Demographics Similar to Immigrants from Sudan by Female Disability
In terms of female disability, the demographic groups most similar to Immigrants from Sudan are Immigrants from Africa (11.9%, a difference of 0.040%), Immigrants from Austria (12.0%, a difference of 0.17%), Estonian (12.0%, a difference of 0.17%), Immigrants from Ecuador (11.9%, a difference of 0.21%), and Romanian (11.9%, a difference of 0.23%).
| Demographics | Rating | Rank | Female Disability |
| Ugandans | 94.0 /100 | #136 | Exceptional 11.9% |
| Immigrants | Norway | 93.8 /100 | #137 | Exceptional 11.9% |
| Ecuadorians | 93.4 /100 | #138 | Exceptional 11.9% |
| Immigrants | Hungary | 92.8 /100 | #139 | Exceptional 11.9% |
| Romanians | 91.6 /100 | #140 | Exceptional 11.9% |
| Immigrants | Ecuador | 91.5 /100 | #141 | Exceptional 11.9% |
| Immigrants | Africa | 90.0 /100 | #142 | Excellent 11.9% |
| Immigrants | Sudan | 89.6 /100 | #143 | Excellent 11.9% |
| Immigrants | Austria | 87.9 /100 | #144 | Excellent 12.0% |
| Estonians | 87.8 /100 | #145 | Excellent 12.0% |
| Pakistanis | 84.6 /100 | #146 | Excellent 12.0% |
| Nigerians | 84.0 /100 | #147 | Excellent 12.0% |
| Immigrants | Kenya | 83.1 /100 | #148 | Excellent 12.0% |
| Greeks | 82.0 /100 | #149 | Excellent 12.0% |
| Immigrants | Moldova | 81.4 /100 | #150 | Excellent 12.0% |