Central American vs Immigrants from Sudan Female Disability
COMPARE
Central American
Immigrants from Sudan
Female Disability
Female Disability Comparison
Central Americans
Immigrants from Sudan
11.9%
FEMALE DISABILITY
94.2/ 100
METRIC RATING
135th/ 347
METRIC RANK
11.9%
FEMALE DISABILITY
89.6/ 100
METRIC RATING
143rd/ 347
METRIC RANK
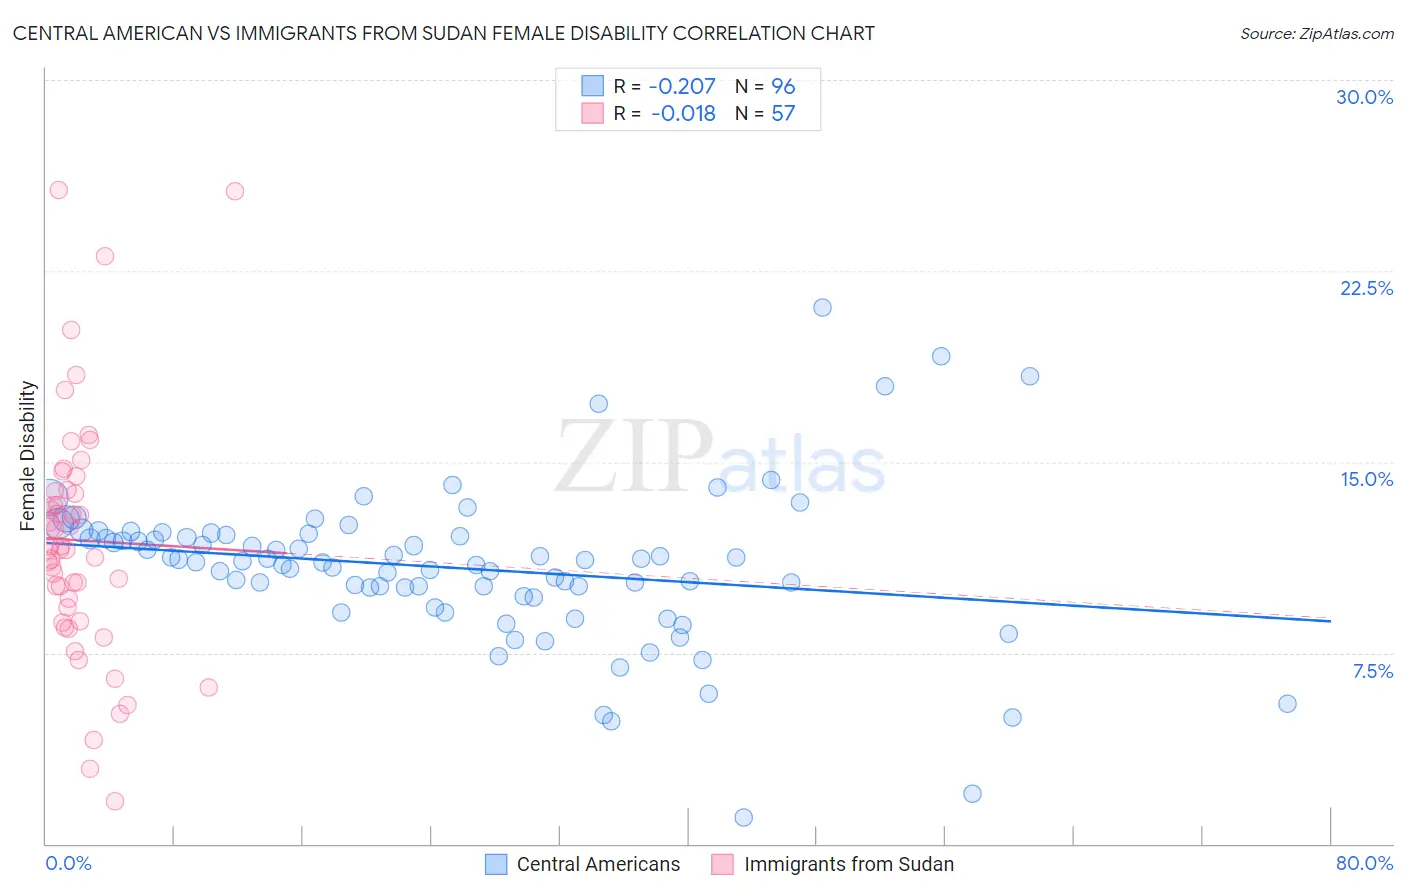
Central American vs Immigrants from Sudan Female Disability Correlation Chart
The statistical analysis conducted on geographies consisting of 504,442,047 people shows a weak negative correlation between the proportion of Central Americans and percentage of females with a disability in the United States with a correlation coefficient (R) of -0.207 and weighted average of 11.9%. Similarly, the statistical analysis conducted on geographies consisting of 118,956,198 people shows no correlation between the proportion of Immigrants from Sudan and percentage of females with a disability in the United States with a correlation coefficient (R) of -0.018 and weighted average of 11.9%, a difference of 0.60%.
Female Disability Correlation Summary
| Measurement | Central American | Immigrants from Sudan |
| Minimum | 1.0% | 1.7% |
| Maximum | 21.1% | 25.7% |
| Range | 20.0% | 24.0% |
| Mean | 10.8% | 11.9% |
| Median | 11.1% | 11.6% |
| Interquartile 25% (IQ1) | 9.9% | 9.0% |
| Interquartile 75% (IQ3) | 12.1% | 13.9% |
| Interquartile Range (IQR) | 2.2% | 4.9% |
| Standard Deviation (Sample) | 3.0% | 4.8% |
| Standard Deviation (Population) | 3.0% | 4.7% |
Demographics Similar to Central Americans and Immigrants from Sudan by Female Disability
In terms of female disability, the demographic groups most similar to Central Americans are Ugandan (11.9%, a difference of 0.030%), Immigrants from Norway (11.9%, a difference of 0.060%), Kenyan (11.9%, a difference of 0.070%), Immigrants from Nicaragua (11.9%, a difference of 0.070%), and Immigrants from Syria (11.9%, a difference of 0.080%). Similarly, the demographic groups most similar to Immigrants from Sudan are Immigrants from Africa (11.9%, a difference of 0.040%), Immigrants from Austria (12.0%, a difference of 0.17%), Estonian (12.0%, a difference of 0.17%), Immigrants from Ecuador (11.9%, a difference of 0.21%), and Romanian (11.9%, a difference of 0.23%).
| Demographics | Rating | Rank | Female Disability |
| Macedonians | 95.5 /100 | #129 | Exceptional 11.8% |
| Nicaraguans | 95.2 /100 | #130 | Exceptional 11.9% |
| Arabs | 95.1 /100 | #131 | Exceptional 11.9% |
| Immigrants | Syria | 94.6 /100 | #132 | Exceptional 11.9% |
| Kenyans | 94.5 /100 | #133 | Exceptional 11.9% |
| Immigrants | Nicaragua | 94.5 /100 | #134 | Exceptional 11.9% |
| Central Americans | 94.2 /100 | #135 | Exceptional 11.9% |
| Ugandans | 94.0 /100 | #136 | Exceptional 11.9% |
| Immigrants | Norway | 93.8 /100 | #137 | Exceptional 11.9% |
| Ecuadorians | 93.4 /100 | #138 | Exceptional 11.9% |
| Immigrants | Hungary | 92.8 /100 | #139 | Exceptional 11.9% |
| Romanians | 91.6 /100 | #140 | Exceptional 11.9% |
| Immigrants | Ecuador | 91.5 /100 | #141 | Exceptional 11.9% |
| Immigrants | Africa | 90.0 /100 | #142 | Excellent 11.9% |
| Immigrants | Sudan | 89.6 /100 | #143 | Excellent 11.9% |
| Immigrants | Austria | 87.9 /100 | #144 | Excellent 12.0% |
| Estonians | 87.8 /100 | #145 | Excellent 12.0% |
| Pakistanis | 84.6 /100 | #146 | Excellent 12.0% |
| Nigerians | 84.0 /100 | #147 | Excellent 12.0% |
| Immigrants | Kenya | 83.1 /100 | #148 | Excellent 12.0% |
| Greeks | 82.0 /100 | #149 | Excellent 12.0% |