Argentinean vs Immigrants from Sudan Female Disability
COMPARE
Argentinean
Immigrants from Sudan
Female Disability
Female Disability Comparison
Argentineans
Immigrants from Sudan
11.0%
FEMALE DISABILITY
100.0/ 100
METRIC RATING
26th/ 347
METRIC RANK
11.9%
FEMALE DISABILITY
89.6/ 100
METRIC RATING
143rd/ 347
METRIC RANK
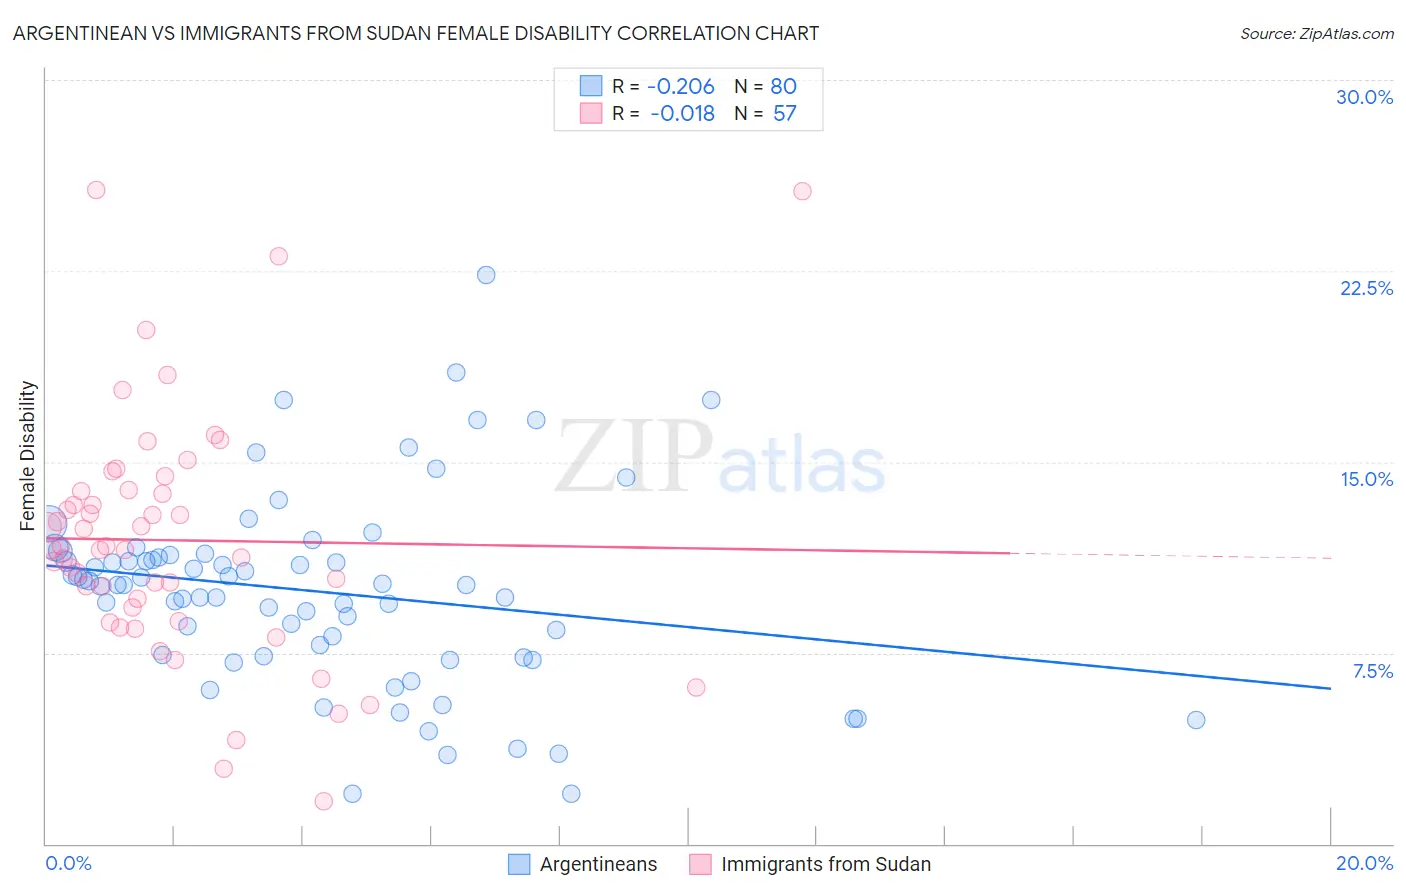
Argentinean vs Immigrants from Sudan Female Disability Correlation Chart
The statistical analysis conducted on geographies consisting of 297,133,447 people shows a weak negative correlation between the proportion of Argentineans and percentage of females with a disability in the United States with a correlation coefficient (R) of -0.206 and weighted average of 11.0%. Similarly, the statistical analysis conducted on geographies consisting of 118,956,198 people shows no correlation between the proportion of Immigrants from Sudan and percentage of females with a disability in the United States with a correlation coefficient (R) of -0.018 and weighted average of 11.9%, a difference of 8.4%.
Female Disability Correlation Summary
| Measurement | Argentinean | Immigrants from Sudan |
| Minimum | 1.9% | 1.7% |
| Maximum | 22.3% | 25.7% |
| Range | 20.4% | 24.0% |
| Mean | 9.9% | 11.9% |
| Median | 10.2% | 11.6% |
| Interquartile 25% (IQ1) | 7.4% | 9.0% |
| Interquartile 75% (IQ3) | 11.3% | 13.9% |
| Interquartile Range (IQR) | 3.9% | 4.9% |
| Standard Deviation (Sample) | 3.8% | 4.8% |
| Standard Deviation (Population) | 3.7% | 4.7% |
Similar Demographics by Female Disability
Demographics Similar to Argentineans by Female Disability
In terms of female disability, the demographic groups most similar to Argentineans are Immigrants from Asia (11.0%, a difference of 0.040%), Immigrants from Argentina (11.0%, a difference of 0.070%), Immigrants from Turkey (11.1%, a difference of 0.40%), Venezuelan (11.0%, a difference of 0.64%), and Egyptian (11.1%, a difference of 0.67%).
| Demographics | Rating | Rank | Female Disability |
| Immigrants | Venezuela | 100.0 /100 | #19 | Exceptional 10.9% |
| Immigrants | Pakistan | 100.0 /100 | #20 | Exceptional 10.9% |
| Asians | 100.0 /100 | #21 | Exceptional 10.9% |
| Immigrants | Sri Lanka | 100.0 /100 | #22 | Exceptional 10.9% |
| Venezuelans | 100.0 /100 | #23 | Exceptional 11.0% |
| Immigrants | Argentina | 100.0 /100 | #24 | Exceptional 11.0% |
| Immigrants | Asia | 100.0 /100 | #25 | Exceptional 11.0% |
| Argentineans | 100.0 /100 | #26 | Exceptional 11.0% |
| Immigrants | Turkey | 100.0 /100 | #27 | Exceptional 11.1% |
| Egyptians | 100.0 /100 | #28 | Exceptional 11.1% |
| Immigrants | Malaysia | 100.0 /100 | #29 | Exceptional 11.1% |
| Turks | 100.0 /100 | #30 | Exceptional 11.1% |
| Immigrants | Kuwait | 100.0 /100 | #31 | Exceptional 11.1% |
| Immigrants | Australia | 100.0 /100 | #32 | Exceptional 11.1% |
| Immigrants | Egypt | 100.0 /100 | #33 | Exceptional 11.1% |
Demographics Similar to Immigrants from Sudan by Female Disability
In terms of female disability, the demographic groups most similar to Immigrants from Sudan are Immigrants from Africa (11.9%, a difference of 0.040%), Immigrants from Austria (12.0%, a difference of 0.17%), Estonian (12.0%, a difference of 0.17%), Immigrants from Ecuador (11.9%, a difference of 0.21%), and Romanian (11.9%, a difference of 0.23%).
| Demographics | Rating | Rank | Female Disability |
| Ugandans | 94.0 /100 | #136 | Exceptional 11.9% |
| Immigrants | Norway | 93.8 /100 | #137 | Exceptional 11.9% |
| Ecuadorians | 93.4 /100 | #138 | Exceptional 11.9% |
| Immigrants | Hungary | 92.8 /100 | #139 | Exceptional 11.9% |
| Romanians | 91.6 /100 | #140 | Exceptional 11.9% |
| Immigrants | Ecuador | 91.5 /100 | #141 | Exceptional 11.9% |
| Immigrants | Africa | 90.0 /100 | #142 | Excellent 11.9% |
| Immigrants | Sudan | 89.6 /100 | #143 | Excellent 11.9% |
| Immigrants | Austria | 87.9 /100 | #144 | Excellent 12.0% |
| Estonians | 87.8 /100 | #145 | Excellent 12.0% |
| Pakistanis | 84.6 /100 | #146 | Excellent 12.0% |
| Nigerians | 84.0 /100 | #147 | Excellent 12.0% |
| Immigrants | Kenya | 83.1 /100 | #148 | Excellent 12.0% |
| Greeks | 82.0 /100 | #149 | Excellent 12.0% |
| Immigrants | Moldova | 81.4 /100 | #150 | Excellent 12.0% |