Slovene vs Immigrants from Lithuania Disability Age 5 to 17
COMPARE
Slovene
Immigrants from Lithuania
Disability Age 5 to 17
Disability Age 5 to 17 Comparison
Slovenes
Immigrants from Lithuania
6.0%
DISABILITY AGE 5 TO 17
0.6/ 100
METRIC RATING
266th/ 347
METRIC RANK
5.1%
DISABILITY AGE 5 TO 17
99.9/ 100
METRIC RATING
53rd/ 347
METRIC RANK
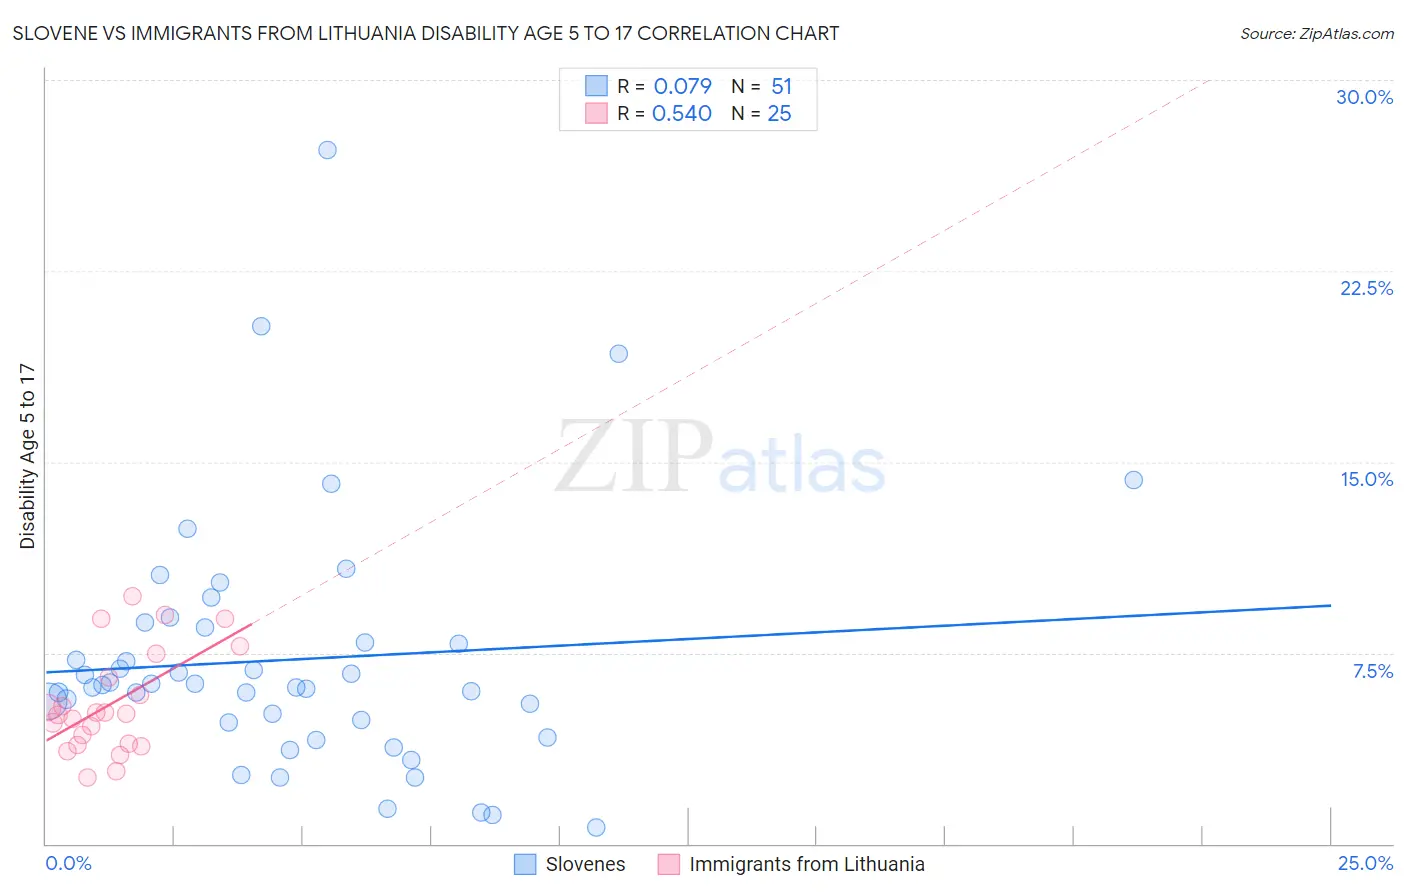
Slovene vs Immigrants from Lithuania Disability Age 5 to 17 Correlation Chart
The statistical analysis conducted on geographies consisting of 259,532,016 people shows a slight positive correlation between the proportion of Slovenes and percentage of population with a disability between the ages 5 and 17 in the United States with a correlation coefficient (R) of 0.079 and weighted average of 6.0%. Similarly, the statistical analysis conducted on geographies consisting of 117,321,416 people shows a substantial positive correlation between the proportion of Immigrants from Lithuania and percentage of population with a disability between the ages 5 and 17 in the United States with a correlation coefficient (R) of 0.540 and weighted average of 5.1%, a difference of 16.6%.
Disability Age 5 to 17 Correlation Summary
| Measurement | Slovene | Immigrants from Lithuania |
| Minimum | 0.63% | 2.6% |
| Maximum | 27.3% | 9.7% |
| Range | 26.6% | 7.1% |
| Mean | 7.2% | 5.5% |
| Median | 6.2% | 5.1% |
| Interquartile 25% (IQ1) | 4.8% | 3.9% |
| Interquartile 75% (IQ3) | 8.5% | 7.0% |
| Interquartile Range (IQR) | 3.7% | 3.1% |
| Standard Deviation (Sample) | 4.9% | 2.0% |
| Standard Deviation (Population) | 4.9% | 2.0% |
Similar Demographics by Disability Age 5 to 17
Demographics Similar to Slovenes by Disability Age 5 to 17
In terms of disability age 5 to 17, the demographic groups most similar to Slovenes are Panamanian (6.0%, a difference of 0.030%), Canadian (6.0%, a difference of 0.10%), Spanish (6.0%, a difference of 0.11%), Czechoslovakian (5.9%, a difference of 0.22%), and Immigrants from Western Africa (5.9%, a difference of 0.30%).
| Demographics | Rating | Rank | Disability Age 5 to 17 |
| Slavs | 0.9 /100 | #259 | Tragic 5.9% |
| Somalis | 0.8 /100 | #260 | Tragic 5.9% |
| Immigrants | Middle Africa | 0.7 /100 | #261 | Tragic 5.9% |
| Immigrants | Western Africa | 0.7 /100 | #262 | Tragic 5.9% |
| Czechoslovakians | 0.7 /100 | #263 | Tragic 5.9% |
| Canadians | 0.6 /100 | #264 | Tragic 6.0% |
| Panamanians | 0.6 /100 | #265 | Tragic 6.0% |
| Slovenes | 0.6 /100 | #266 | Tragic 6.0% |
| Spanish | 0.5 /100 | #267 | Tragic 6.0% |
| Sioux | 0.4 /100 | #268 | Tragic 6.0% |
| Liberians | 0.4 /100 | #269 | Tragic 6.0% |
| Immigrants | Somalia | 0.4 /100 | #270 | Tragic 6.0% |
| Immigrants | Zaire | 0.2 /100 | #271 | Tragic 6.0% |
| Finns | 0.2 /100 | #272 | Tragic 6.0% |
| Alaska Natives | 0.2 /100 | #273 | Tragic 6.0% |
Demographics Similar to Immigrants from Lithuania by Disability Age 5 to 17
In terms of disability age 5 to 17, the demographic groups most similar to Immigrants from Lithuania are Paraguayan (5.1%, a difference of 0.030%), Immigrants from Fiji (5.1%, a difference of 0.050%), Laotian (5.1%, a difference of 0.070%), Immigrants from Turkey (5.1%, a difference of 0.090%), and Turkish (5.1%, a difference of 0.14%).
| Demographics | Rating | Rank | Disability Age 5 to 17 |
| Assyrians/Chaldeans/Syriacs | 100.0 /100 | #46 | Exceptional 5.0% |
| Vietnamese | 100.0 /100 | #47 | Exceptional 5.1% |
| Koreans | 100.0 /100 | #48 | Exceptional 5.1% |
| Immigrants | Western Asia | 100.0 /100 | #49 | Exceptional 5.1% |
| Argentineans | 99.9 /100 | #50 | Exceptional 5.1% |
| Turks | 99.9 /100 | #51 | Exceptional 5.1% |
| Immigrants | Fiji | 99.9 /100 | #52 | Exceptional 5.1% |
| Immigrants | Lithuania | 99.9 /100 | #53 | Exceptional 5.1% |
| Paraguayans | 99.9 /100 | #54 | Exceptional 5.1% |
| Laotians | 99.9 /100 | #55 | Exceptional 5.1% |
| Immigrants | Turkey | 99.9 /100 | #56 | Exceptional 5.1% |
| Immigrants | Poland | 99.9 /100 | #57 | Exceptional 5.1% |
| Immigrants | Ukraine | 99.9 /100 | #58 | Exceptional 5.1% |
| Immigrants | North Macedonia | 99.9 /100 | #59 | Exceptional 5.1% |
| Immigrants | Eastern Europe | 99.9 /100 | #60 | Exceptional 5.1% |