Slovak vs Tsimshian Self-Care Disability
COMPARE
Slovak
Tsimshian
Self-Care Disability
Self-Care Disability Comparison
Slovaks
Tsimshian
2.5%
SELF-CARE DISABILITY
12.6/ 100
METRIC RATING
202nd/ 347
METRIC RANK
2.6%
SELF-CARE DISABILITY
0.3/ 100
METRIC RATING
255th/ 347
METRIC RANK
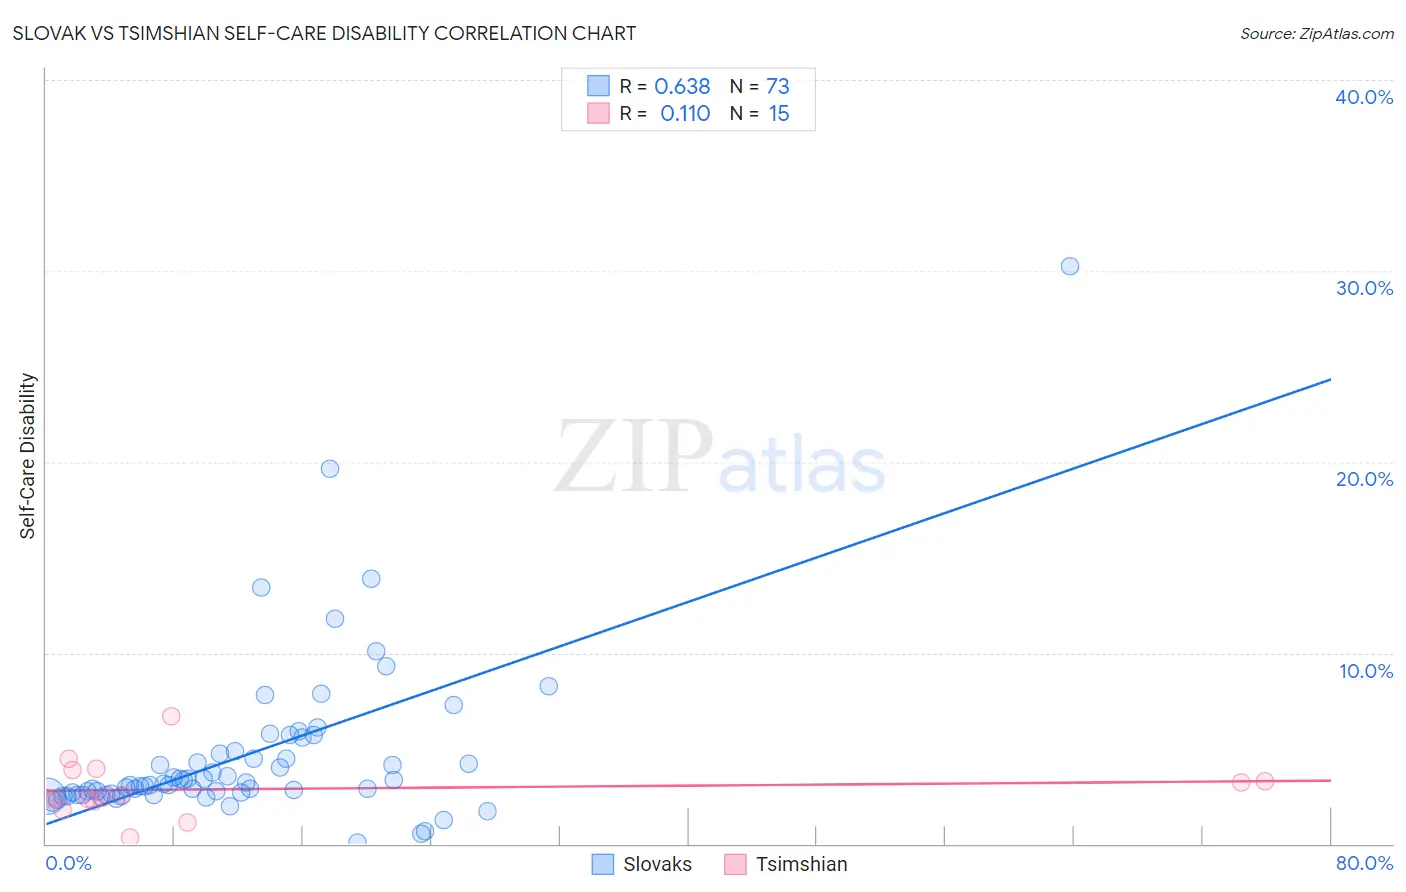
Slovak vs Tsimshian Self-Care Disability Correlation Chart
The statistical analysis conducted on geographies consisting of 397,370,448 people shows a significant positive correlation between the proportion of Slovaks and percentage of population with self-care disability in the United States with a correlation coefficient (R) of 0.638 and weighted average of 2.5%. Similarly, the statistical analysis conducted on geographies consisting of 15,618,387 people shows a poor positive correlation between the proportion of Tsimshian and percentage of population with self-care disability in the United States with a correlation coefficient (R) of 0.110 and weighted average of 2.6%, a difference of 4.4%.
Self-Care Disability Correlation Summary
| Measurement | Slovak | Tsimshian |
| Minimum | 0.091% | 0.32% |
| Maximum | 30.2% | 6.7% |
| Range | 30.1% | 6.4% |
| Mean | 4.6% | 2.9% |
| Median | 3.1% | 2.4% |
| Interquartile 25% (IQ1) | 2.6% | 2.2% |
| Interquartile 75% (IQ3) | 4.8% | 3.9% |
| Interquartile Range (IQR) | 2.2% | 1.6% |
| Standard Deviation (Sample) | 4.4% | 1.5% |
| Standard Deviation (Population) | 4.4% | 1.5% |
Similar Demographics by Self-Care Disability
Demographics Similar to Slovaks by Self-Care Disability
In terms of self-care disability, the demographic groups most similar to Slovaks are Immigrants from Lebanon (2.5%, a difference of 0.020%), Immigrants from South Eastern Asia (2.5%, a difference of 0.030%), Immigrants from Western Africa (2.5%, a difference of 0.070%), Immigrants from Bahamas (2.5%, a difference of 0.080%), and Immigrants from Russia (2.5%, a difference of 0.18%).
| Demographics | Rating | Rank | Self-Care Disability |
| Immigrants | Southern Europe | 15.6 /100 | #195 | Poor 2.5% |
| Koreans | 15.5 /100 | #196 | Poor 2.5% |
| Crow | 15.2 /100 | #197 | Poor 2.5% |
| Immigrants | Immigrants | 15.0 /100 | #198 | Poor 2.5% |
| Immigrants | Ghana | 14.7 /100 | #199 | Poor 2.5% |
| Immigrants | Western Africa | 13.3 /100 | #200 | Poor 2.5% |
| Immigrants | South Eastern Asia | 12.9 /100 | #201 | Poor 2.5% |
| Slovaks | 12.6 /100 | #202 | Poor 2.5% |
| Immigrants | Lebanon | 12.4 /100 | #203 | Poor 2.5% |
| Immigrants | Bahamas | 11.9 /100 | #204 | Poor 2.5% |
| Immigrants | Russia | 11.0 /100 | #205 | Poor 2.5% |
| Alaskan Athabascans | 10.4 /100 | #206 | Poor 2.5% |
| French | 9.9 /100 | #207 | Tragic 2.5% |
| Central Americans | 8.7 /100 | #208 | Tragic 2.5% |
| Malaysians | 7.7 /100 | #209 | Tragic 2.5% |
Demographics Similar to Tsimshian by Self-Care Disability
In terms of self-care disability, the demographic groups most similar to Tsimshian are Immigrants from Central America (2.6%, a difference of 0.020%), Haitian (2.6%, a difference of 0.040%), Immigrants from Haiti (2.6%, a difference of 0.060%), Immigrants from Bangladesh (2.6%, a difference of 0.14%), and Immigrants from Liberia (2.6%, a difference of 0.21%).
| Demographics | Rating | Rank | Self-Care Disability |
| Nicaraguans | 0.6 /100 | #248 | Tragic 2.6% |
| Mexican American Indians | 0.5 /100 | #249 | Tragic 2.6% |
| Portuguese | 0.4 /100 | #250 | Tragic 2.6% |
| Immigrants | Liberia | 0.4 /100 | #251 | Tragic 2.6% |
| Immigrants | Bangladesh | 0.4 /100 | #252 | Tragic 2.6% |
| Immigrants | Haiti | 0.3 /100 | #253 | Tragic 2.6% |
| Haitians | 0.3 /100 | #254 | Tragic 2.6% |
| Tsimshian | 0.3 /100 | #255 | Tragic 2.6% |
| Immigrants | Central America | 0.3 /100 | #256 | Tragic 2.6% |
| Potawatomi | 0.3 /100 | #257 | Tragic 2.6% |
| Immigrants | Nonimmigrants | 0.3 /100 | #258 | Tragic 2.6% |
| Immigrants | Belarus | 0.2 /100 | #259 | Tragic 2.6% |
| Chippewa | 0.2 /100 | #260 | Tragic 2.6% |
| Arapaho | 0.2 /100 | #261 | Tragic 2.6% |
| Shoshone | 0.2 /100 | #262 | Tragic 2.7% |