Slavic vs Immigrants from Argentina Disability Age 5 to 17
COMPARE
Slavic
Immigrants from Argentina
Disability Age 5 to 17
Disability Age 5 to 17 Comparison
Slavs
Immigrants from Argentina
5.9%
DISABILITY AGE 5 TO 17
0.9/ 100
METRIC RATING
259th/ 347
METRIC RANK
5.0%
DISABILITY AGE 5 TO 17
100.0/ 100
METRIC RATING
39th/ 347
METRIC RANK
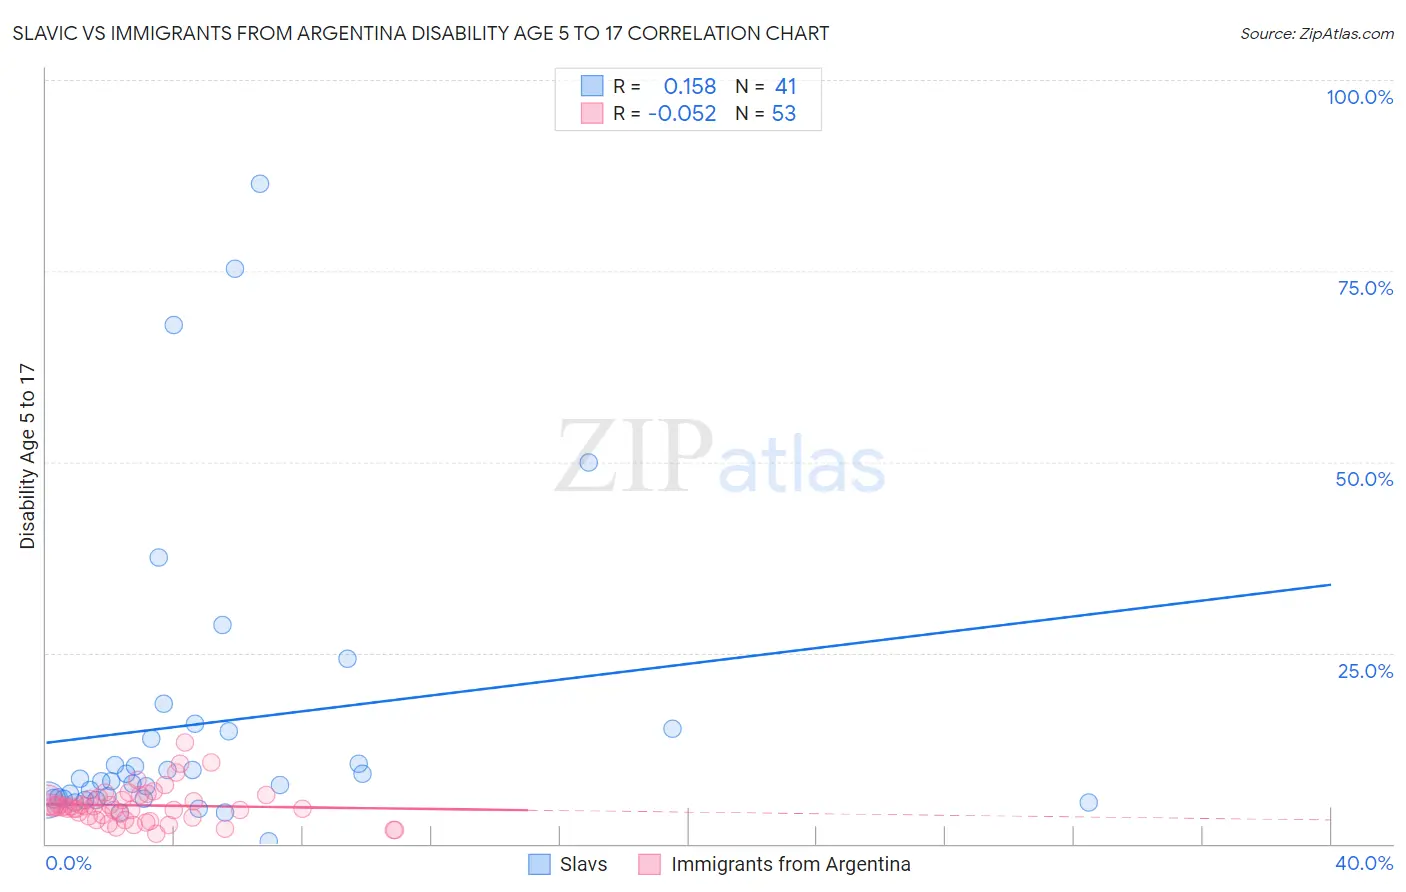
Slavic vs Immigrants from Argentina Disability Age 5 to 17 Correlation Chart
The statistical analysis conducted on geographies consisting of 269,139,689 people shows a poor positive correlation between the proportion of Slavs and percentage of population with a disability between the ages 5 and 17 in the United States with a correlation coefficient (R) of 0.158 and weighted average of 5.9%. Similarly, the statistical analysis conducted on geographies consisting of 262,882,826 people shows a slight negative correlation between the proportion of Immigrants from Argentina and percentage of population with a disability between the ages 5 and 17 in the United States with a correlation coefficient (R) of -0.052 and weighted average of 5.0%, a difference of 18.3%.
Disability Age 5 to 17 Correlation Summary
| Measurement | Slavic | Immigrants from Argentina |
| Minimum | 0.37% | 1.3% |
| Maximum | 86.4% | 13.2% |
| Range | 86.0% | 11.9% |
| Mean | 15.8% | 5.0% |
| Median | 8.3% | 4.8% |
| Interquartile 25% (IQ1) | 5.9% | 3.5% |
| Interquartile 75% (IQ3) | 14.8% | 6.0% |
| Interquartile Range (IQR) | 8.9% | 2.5% |
| Standard Deviation (Sample) | 19.7% | 2.3% |
| Standard Deviation (Population) | 19.5% | 2.3% |
Similar Demographics by Disability Age 5 to 17
Demographics Similar to Slavs by Disability Age 5 to 17
In terms of disability age 5 to 17, the demographic groups most similar to Slavs are Brazilian (5.9%, a difference of 0.060%), Hispanic or Latino (5.9%, a difference of 0.090%), Somali (5.9%, a difference of 0.13%), Hopi (5.9%, a difference of 0.18%), and Immigrants from Middle Africa (5.9%, a difference of 0.20%).
| Demographics | Rating | Rank | Disability Age 5 to 17 |
| Hondurans | 1.5 /100 | #252 | Tragic 5.9% |
| Scandinavians | 1.4 /100 | #253 | Tragic 5.9% |
| Barbadians | 1.3 /100 | #254 | Tragic 5.9% |
| Italians | 1.2 /100 | #255 | Tragic 5.9% |
| Hopi | 1.0 /100 | #256 | Tragic 5.9% |
| Hispanics or Latinos | 1.0 /100 | #257 | Tragic 5.9% |
| Brazilians | 0.9 /100 | #258 | Tragic 5.9% |
| Slavs | 0.9 /100 | #259 | Tragic 5.9% |
| Somalis | 0.8 /100 | #260 | Tragic 5.9% |
| Immigrants | Middle Africa | 0.7 /100 | #261 | Tragic 5.9% |
| Immigrants | Western Africa | 0.7 /100 | #262 | Tragic 5.9% |
| Czechoslovakians | 0.7 /100 | #263 | Tragic 5.9% |
| Canadians | 0.6 /100 | #264 | Tragic 6.0% |
| Panamanians | 0.6 /100 | #265 | Tragic 6.0% |
| Slovenes | 0.6 /100 | #266 | Tragic 6.0% |
Demographics Similar to Immigrants from Argentina by Disability Age 5 to 17
In terms of disability age 5 to 17, the demographic groups most similar to Immigrants from Argentina are Immigrants from Philippines (5.0%, a difference of 0.010%), Immigrants from Belarus (5.0%, a difference of 0.050%), Immigrants from Egypt (5.0%, a difference of 0.080%), Okinawan (5.0%, a difference of 0.080%), and Bolivian (5.0%, a difference of 0.12%).
| Demographics | Rating | Rank | Disability Age 5 to 17 |
| Soviet Union | 100.0 /100 | #32 | Exceptional 5.0% |
| Immigrants | Indonesia | 100.0 /100 | #33 | Exceptional 5.0% |
| Israelis | 100.0 /100 | #34 | Exceptional 5.0% |
| Bolivians | 100.0 /100 | #35 | Exceptional 5.0% |
| Immigrants | Egypt | 100.0 /100 | #36 | Exceptional 5.0% |
| Immigrants | Belarus | 100.0 /100 | #37 | Exceptional 5.0% |
| Immigrants | Philippines | 100.0 /100 | #38 | Exceptional 5.0% |
| Immigrants | Argentina | 100.0 /100 | #39 | Exceptional 5.0% |
| Okinawans | 100.0 /100 | #40 | Exceptional 5.0% |
| Immigrants | Australia | 100.0 /100 | #41 | Exceptional 5.0% |
| Immigrants | Sri Lanka | 100.0 /100 | #42 | Exceptional 5.0% |
| Immigrants | Russia | 100.0 /100 | #43 | Exceptional 5.0% |
| Egyptians | 100.0 /100 | #44 | Exceptional 5.0% |
| Tongans | 100.0 /100 | #45 | Exceptional 5.0% |
| Assyrians/Chaldeans/Syriacs | 100.0 /100 | #46 | Exceptional 5.0% |