Slavic vs Immigrants from Argentina 2nd Grade
COMPARE
Slavic
Immigrants from Argentina
2nd Grade
2nd Grade Comparison
Slavs
Immigrants from Argentina
98.3%
2ND GRADE
99.8/ 100
METRIC RATING
59th/ 347
METRIC RANK
97.8%
2ND GRADE
40.6/ 100
METRIC RATING
185th/ 347
METRIC RANK
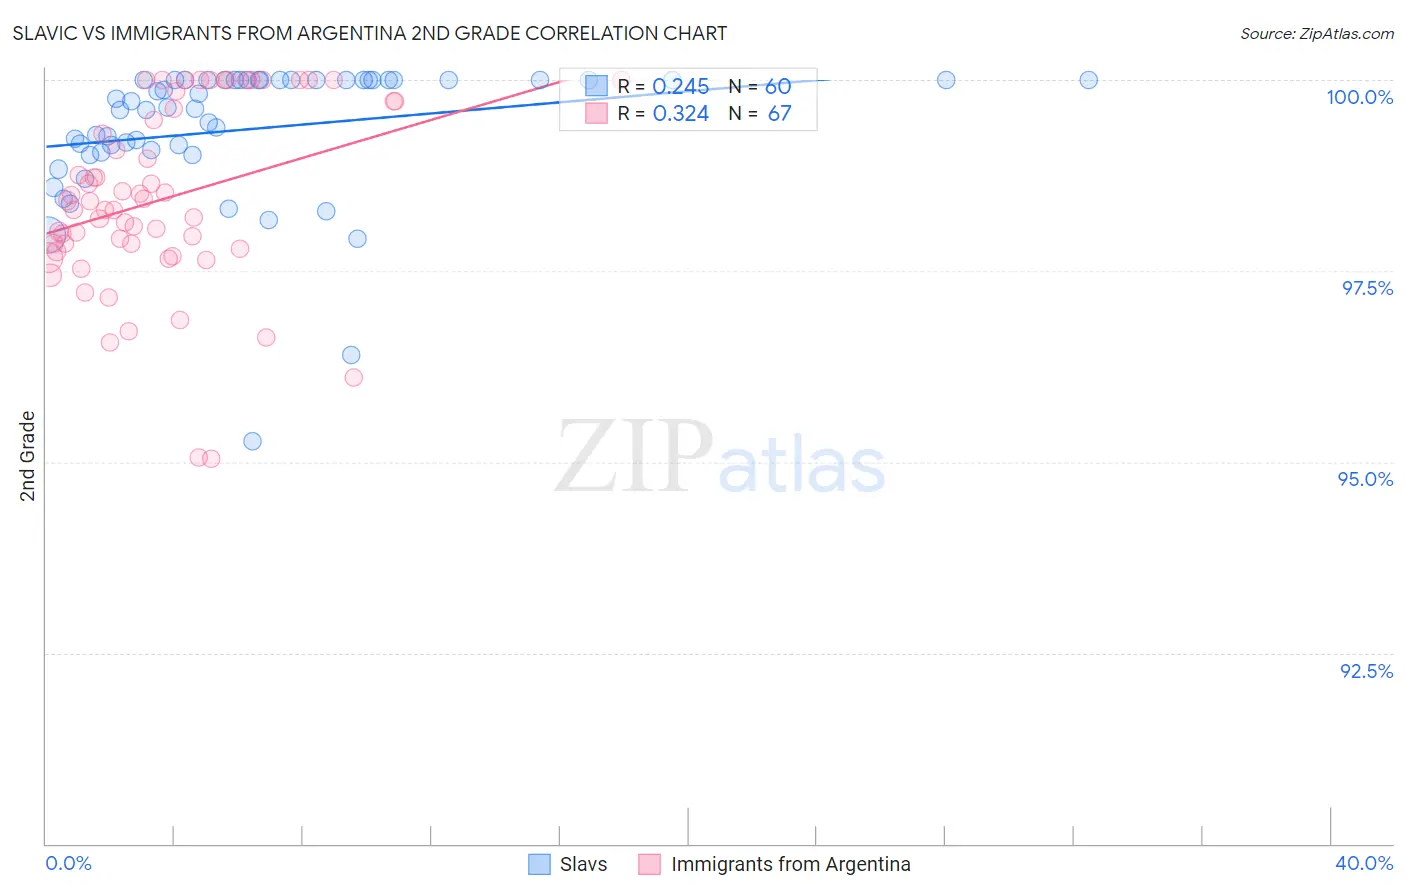
Slavic vs Immigrants from Argentina 2nd Grade Correlation Chart
The statistical analysis conducted on geographies consisting of 270,869,056 people shows a weak positive correlation between the proportion of Slavs and percentage of population with at least 2nd grade education in the United States with a correlation coefficient (R) of 0.245 and weighted average of 98.3%. Similarly, the statistical analysis conducted on geographies consisting of 264,429,773 people shows a mild positive correlation between the proportion of Immigrants from Argentina and percentage of population with at least 2nd grade education in the United States with a correlation coefficient (R) of 0.324 and weighted average of 97.8%, a difference of 0.51%.
2nd Grade Correlation Summary
| Measurement | Slavic | Immigrants from Argentina |
| Minimum | 95.3% | 95.0% |
| Maximum | 100.0% | 100.0% |
| Range | 4.7% | 5.0% |
| Mean | 99.4% | 98.4% |
| Median | 99.7% | 98.4% |
| Interquartile 25% (IQ1) | 99.1% | 97.8% |
| Interquartile 75% (IQ3) | 100.0% | 99.7% |
| Interquartile Range (IQR) | 0.93% | 1.9% |
| Standard Deviation (Sample) | 0.91% | 1.2% |
| Standard Deviation (Population) | 0.90% | 1.2% |
Similar Demographics by 2nd Grade
Demographics Similar to Slavs by 2nd Grade
In terms of 2nd grade, the demographic groups most similar to Slavs are Creek (98.3%, a difference of 0.0%), Immigrants from Canada (98.3%, a difference of 0.0%), Greek (98.3%, a difference of 0.0%), American (98.3%, a difference of 0.010%), and Austrian (98.3%, a difference of 0.010%).
| Demographics | Rating | Rank | 2nd Grade |
| Australians | 99.8 /100 | #52 | Exceptional 98.4% |
| Pueblo | 99.8 /100 | #53 | Exceptional 98.3% |
| Kiowa | 99.8 /100 | #54 | Exceptional 98.3% |
| Immigrants | Scotland | 99.8 /100 | #55 | Exceptional 98.3% |
| Americans | 99.8 /100 | #56 | Exceptional 98.3% |
| Austrians | 99.8 /100 | #57 | Exceptional 98.3% |
| Bulgarians | 99.8 /100 | #58 | Exceptional 98.3% |
| Slavs | 99.8 /100 | #59 | Exceptional 98.3% |
| Creek | 99.8 /100 | #60 | Exceptional 98.3% |
| Immigrants | Canada | 99.8 /100 | #61 | Exceptional 98.3% |
| Greeks | 99.8 /100 | #62 | Exceptional 98.3% |
| Maltese | 99.7 /100 | #63 | Exceptional 98.3% |
| Immigrants | North America | 99.7 /100 | #64 | Exceptional 98.3% |
| New Zealanders | 99.7 /100 | #65 | Exceptional 98.3% |
| Canadians | 99.7 /100 | #66 | Exceptional 98.3% |
Demographics Similar to Immigrants from Argentina by 2nd Grade
In terms of 2nd grade, the demographic groups most similar to Immigrants from Argentina are Immigrants from Belarus (97.8%, a difference of 0.0%), Native/Alaskan (97.9%, a difference of 0.010%), Egyptian (97.9%, a difference of 0.010%), Portuguese (97.8%, a difference of 0.010%), and Immigrants from Poland (97.8%, a difference of 0.010%).
| Demographics | Rating | Rank | 2nd Grade |
| Argentineans | 46.3 /100 | #178 | Average 97.9% |
| Immigrants | Venezuela | 46.1 /100 | #179 | Average 97.9% |
| Natives/Alaskans | 44.3 /100 | #180 | Average 97.9% |
| Egyptians | 44.3 /100 | #181 | Average 97.9% |
| Portuguese | 42.4 /100 | #182 | Average 97.8% |
| Immigrants | Poland | 42.2 /100 | #183 | Average 97.8% |
| Immigrants | Belarus | 41.5 /100 | #184 | Average 97.8% |
| Immigrants | Argentina | 40.6 /100 | #185 | Average 97.8% |
| Arabs | 36.9 /100 | #186 | Fair 97.8% |
| Pakistanis | 36.1 /100 | #187 | Fair 97.8% |
| Immigrants | Kazakhstan | 35.6 /100 | #188 | Fair 97.8% |
| Panamanians | 33.5 /100 | #189 | Fair 97.8% |
| Immigrants | Taiwan | 31.8 /100 | #190 | Fair 97.8% |
| Paraguayans | 30.8 /100 | #191 | Fair 97.8% |
| Blacks/African Americans | 29.9 /100 | #192 | Fair 97.8% |