Albanian vs Bermudan Vision Disability
COMPARE
Albanian
Bermudan
Vision Disability
Vision Disability Comparison
Albanians
Bermudans
2.1%
VISION DISABILITY
94.9/ 100
METRIC RATING
101st/ 347
METRIC RANK
2.2%
VISION DISABILITY
9.0/ 100
METRIC RATING
212th/ 347
METRIC RANK
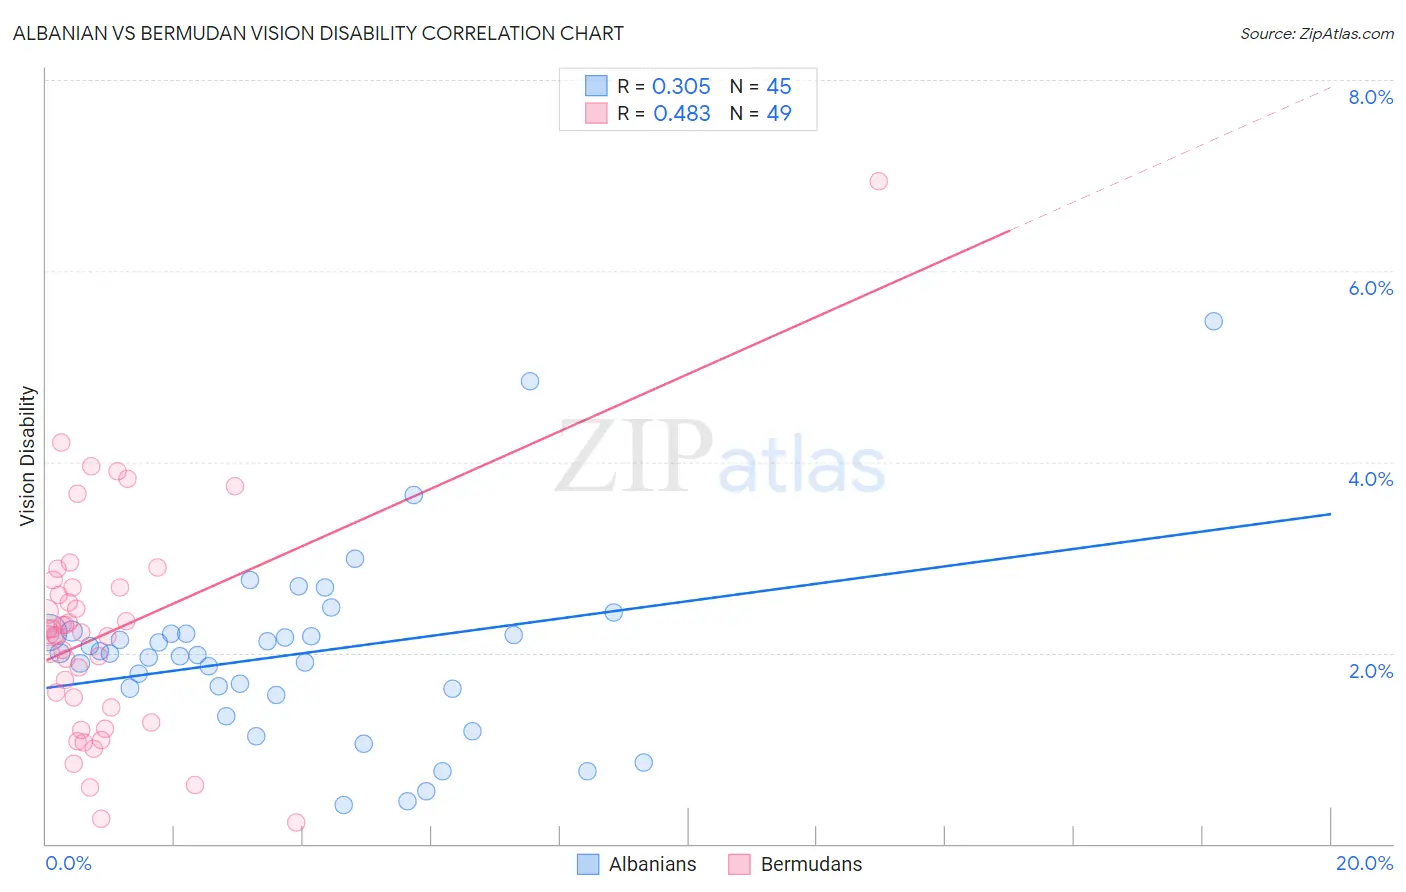
Albanian vs Bermudan Vision Disability Correlation Chart
The statistical analysis conducted on geographies consisting of 193,200,917 people shows a mild positive correlation between the proportion of Albanians and percentage of population with vision disability in the United States with a correlation coefficient (R) of 0.305 and weighted average of 2.1%. Similarly, the statistical analysis conducted on geographies consisting of 55,718,331 people shows a moderate positive correlation between the proportion of Bermudans and percentage of population with vision disability in the United States with a correlation coefficient (R) of 0.483 and weighted average of 2.2%, a difference of 8.6%.
Vision Disability Correlation Summary
| Measurement | Albanian | Bermudan |
| Minimum | 0.41% | 0.22% |
| Maximum | 5.5% | 6.9% |
| Range | 5.1% | 6.7% |
| Mean | 2.0% | 2.2% |
| Median | 2.0% | 2.2% |
| Interquartile 25% (IQ1) | 1.6% | 1.3% |
| Interquartile 75% (IQ3) | 2.2% | 2.7% |
| Interquartile Range (IQR) | 0.61% | 1.3% |
| Standard Deviation (Sample) | 0.97% | 1.2% |
| Standard Deviation (Population) | 0.96% | 1.2% |
Similar Demographics by Vision Disability
Demographics Similar to Albanians by Vision Disability
In terms of vision disability, the demographic groups most similar to Albanians are Sri Lankan (2.1%, a difference of 0.030%), Greek (2.1%, a difference of 0.080%), Estonian (2.1%, a difference of 0.12%), Immigrants from Austria (2.1%, a difference of 0.17%), and Immigrants from Italy (2.1%, a difference of 0.17%).
| Demographics | Rating | Rank | Vision Disability |
| Immigrants | Croatia | 96.0 /100 | #94 | Exceptional 2.1% |
| Australians | 95.9 /100 | #95 | Exceptional 2.1% |
| Romanians | 95.7 /100 | #96 | Exceptional 2.1% |
| Immigrants | Afghanistan | 95.6 /100 | #97 | Exceptional 2.1% |
| Immigrants | South Africa | 95.4 /100 | #98 | Exceptional 2.1% |
| Estonians | 95.3 /100 | #99 | Exceptional 2.1% |
| Greeks | 95.1 /100 | #100 | Exceptional 2.1% |
| Albanians | 94.9 /100 | #101 | Exceptional 2.1% |
| Sri Lankans | 94.8 /100 | #102 | Exceptional 2.1% |
| Immigrants | Austria | 94.4 /100 | #103 | Exceptional 2.1% |
| Immigrants | Italy | 94.4 /100 | #104 | Exceptional 2.1% |
| Carpatho Rusyns | 94.3 /100 | #105 | Exceptional 2.1% |
| Swedes | 94.2 /100 | #106 | Exceptional 2.1% |
| Danes | 94.2 /100 | #107 | Exceptional 2.1% |
| Koreans | 94.1 /100 | #108 | Exceptional 2.1% |
Demographics Similar to Bermudans by Vision Disability
In terms of vision disability, the demographic groups most similar to Bermudans are Immigrants from Ghana (2.2%, a difference of 0.010%), Indonesian (2.2%, a difference of 0.090%), Trinidadian and Tobagonian (2.2%, a difference of 0.14%), Nigerian (2.3%, a difference of 0.35%), and Immigrants from Uruguay (2.2%, a difference of 0.43%).
| Demographics | Rating | Rank | Vision Disability |
| Samoans | 15.7 /100 | #205 | Poor 2.2% |
| Pennsylvania Germans | 14.5 /100 | #206 | Poor 2.2% |
| Immigrants | Nigeria | 13.5 /100 | #207 | Poor 2.2% |
| Germans | 13.4 /100 | #208 | Poor 2.2% |
| Immigrants | Brazil | 13.1 /100 | #209 | Poor 2.2% |
| Immigrants | Uruguay | 11.5 /100 | #210 | Poor 2.2% |
| Indonesians | 9.5 /100 | #211 | Tragic 2.2% |
| Bermudans | 9.0 /100 | #212 | Tragic 2.2% |
| Immigrants | Ghana | 8.9 /100 | #213 | Tragic 2.2% |
| Trinidadians and Tobagonians | 8.2 /100 | #214 | Tragic 2.2% |
| Nigerians | 7.2 /100 | #215 | Tragic 2.3% |
| Immigrants | Trinidad and Tobago | 6.1 /100 | #216 | Tragic 2.3% |
| Barbadians | 5.1 /100 | #217 | Tragic 2.3% |
| Portuguese | 4.9 /100 | #218 | Tragic 2.3% |
| Ecuadorians | 4.6 /100 | #219 | Tragic 2.3% |