Slavic vs Immigrants from Norway Vision Disability
COMPARE
Slavic
Immigrants from Norway
Vision Disability
Vision Disability Comparison
Slavs
Immigrants from Norway
2.2%
VISION DISABILITY
46.0/ 100
METRIC RATING
177th/ 347
METRIC RANK
2.1%
VISION DISABILITY
75.5/ 100
METRIC RATING
151st/ 347
METRIC RANK
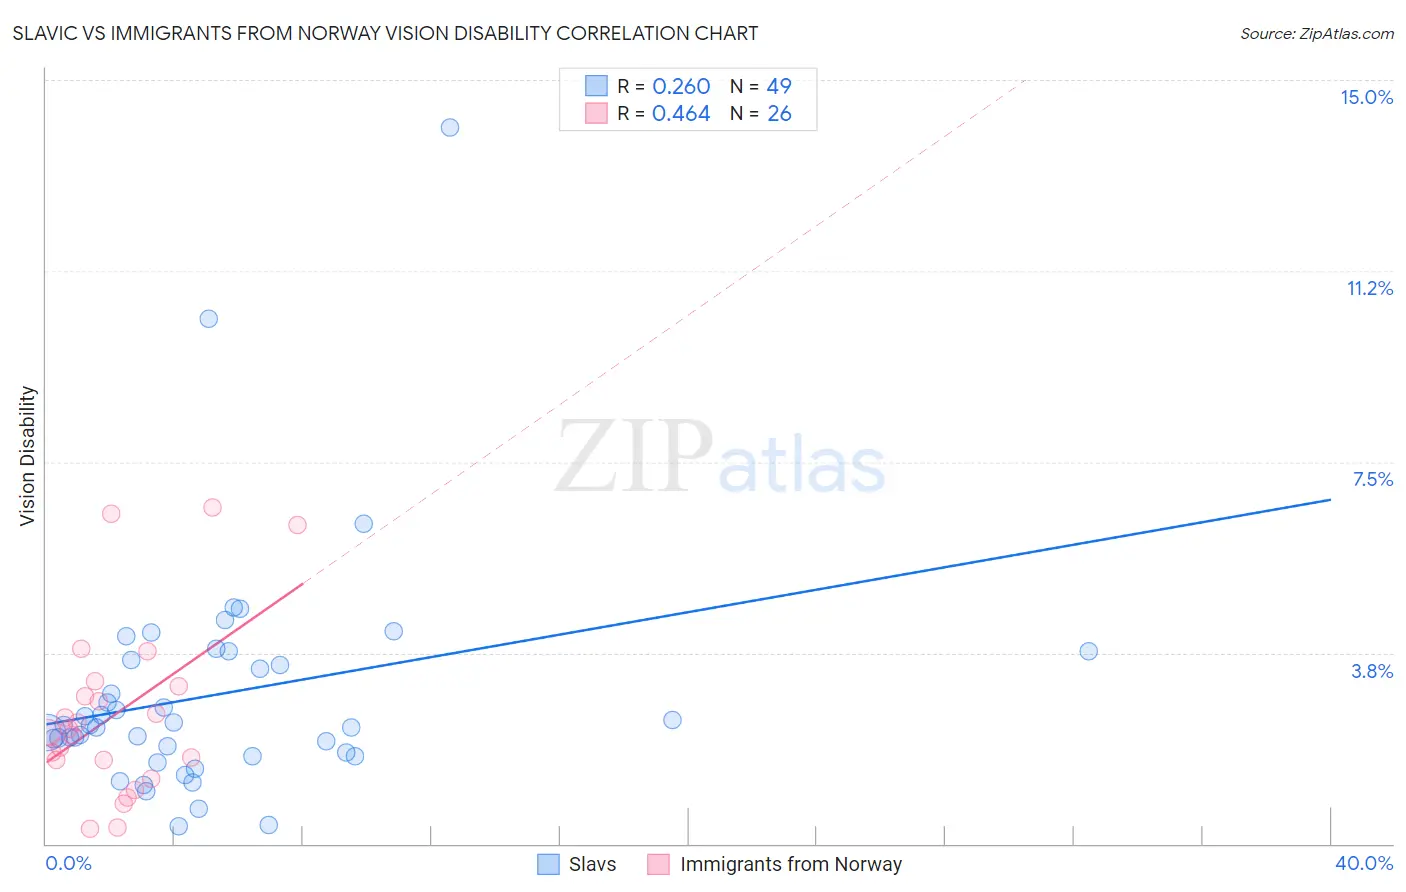
Slavic vs Immigrants from Norway Vision Disability Correlation Chart
The statistical analysis conducted on geographies consisting of 270,742,725 people shows a weak positive correlation between the proportion of Slavs and percentage of population with vision disability in the United States with a correlation coefficient (R) of 0.260 and weighted average of 2.2%. Similarly, the statistical analysis conducted on geographies consisting of 116,669,624 people shows a moderate positive correlation between the proportion of Immigrants from Norway and percentage of population with vision disability in the United States with a correlation coefficient (R) of 0.464 and weighted average of 2.1%, a difference of 2.1%.
Vision Disability Correlation Summary
| Measurement | Slavic | Immigrants from Norway |
| Minimum | 0.34% | 0.30% |
| Maximum | 14.1% | 6.6% |
| Range | 13.7% | 6.3% |
| Mean | 2.9% | 2.5% |
| Median | 2.3% | 2.2% |
| Interquartile 25% (IQ1) | 1.8% | 1.6% |
| Interquartile 75% (IQ3) | 3.7% | 3.1% |
| Interquartile Range (IQR) | 1.9% | 1.4% |
| Standard Deviation (Sample) | 2.3% | 1.7% |
| Standard Deviation (Population) | 2.3% | 1.7% |
Similar Demographics by Vision Disability
Demographics Similar to Slavs by Vision Disability
In terms of vision disability, the demographic groups most similar to Slavs are Yugoslavian (2.2%, a difference of 0.040%), Immigrants from Oceania (2.2%, a difference of 0.050%), Immigrants from North America (2.2%, a difference of 0.090%), Immigrants from Fiji (2.2%, a difference of 0.11%), and Uruguayan (2.2%, a difference of 0.21%).
| Demographics | Rating | Rank | Vision Disability |
| Swiss | 55.7 /100 | #170 | Average 2.2% |
| Lebanese | 54.3 /100 | #171 | Average 2.2% |
| Northern Europeans | 50.1 /100 | #172 | Average 2.2% |
| Scandinavians | 50.0 /100 | #173 | Average 2.2% |
| Immigrants | Canada | 50.0 /100 | #174 | Average 2.2% |
| Immigrants | Fiji | 47.6 /100 | #175 | Average 2.2% |
| Yugoslavians | 46.5 /100 | #176 | Average 2.2% |
| Slavs | 46.0 /100 | #177 | Average 2.2% |
| Immigrants | Oceania | 45.1 /100 | #178 | Average 2.2% |
| Immigrants | North America | 44.5 /100 | #179 | Average 2.2% |
| Uruguayans | 42.7 /100 | #180 | Average 2.2% |
| Immigrants | Western Europe | 41.1 /100 | #181 | Average 2.2% |
| Costa Ricans | 40.7 /100 | #182 | Average 2.2% |
| Immigrants | Burma/Myanmar | 37.9 /100 | #183 | Fair 2.2% |
| Moroccans | 35.4 /100 | #184 | Fair 2.2% |
Demographics Similar to Immigrants from Norway by Vision Disability
In terms of vision disability, the demographic groups most similar to Immigrants from Norway are Belgian (2.1%, a difference of 0.040%), Colombian (2.1%, a difference of 0.070%), Immigrants from Southern Europe (2.1%, a difference of 0.080%), Immigrants from South America (2.1%, a difference of 0.15%), and Slovene (2.1%, a difference of 0.16%).
| Demographics | Rating | Rank | Vision Disability |
| Ukrainians | 81.9 /100 | #144 | Excellent 2.1% |
| Immigrants | Bosnia and Herzegovina | 81.5 /100 | #145 | Excellent 2.1% |
| Italians | 79.7 /100 | #146 | Good 2.1% |
| Immigrants | Sudan | 78.4 /100 | #147 | Good 2.1% |
| Finns | 78.3 /100 | #148 | Good 2.1% |
| Colombians | 76.2 /100 | #149 | Good 2.1% |
| Belgians | 75.9 /100 | #150 | Good 2.1% |
| Immigrants | Norway | 75.5 /100 | #151 | Good 2.1% |
| Immigrants | Southern Europe | 74.6 /100 | #152 | Good 2.1% |
| Immigrants | South America | 73.8 /100 | #153 | Good 2.1% |
| Slovenes | 73.6 /100 | #154 | Good 2.1% |
| Immigrants | Colombia | 72.1 /100 | #155 | Good 2.1% |
| Pakistanis | 71.6 /100 | #156 | Good 2.1% |
| Serbians | 70.2 /100 | #157 | Good 2.1% |
| Immigrants | Uzbekistan | 69.9 /100 | #158 | Good 2.1% |