Colville vs Bermudan Vision Disability
COMPARE
Colville
Bermudan
Vision Disability
Vision Disability Comparison
Colville
Bermudans
3.0%
VISION DISABILITY
0.0/ 100
METRIC RATING
330th/ 347
METRIC RANK
2.2%
VISION DISABILITY
9.0/ 100
METRIC RATING
212th/ 347
METRIC RANK
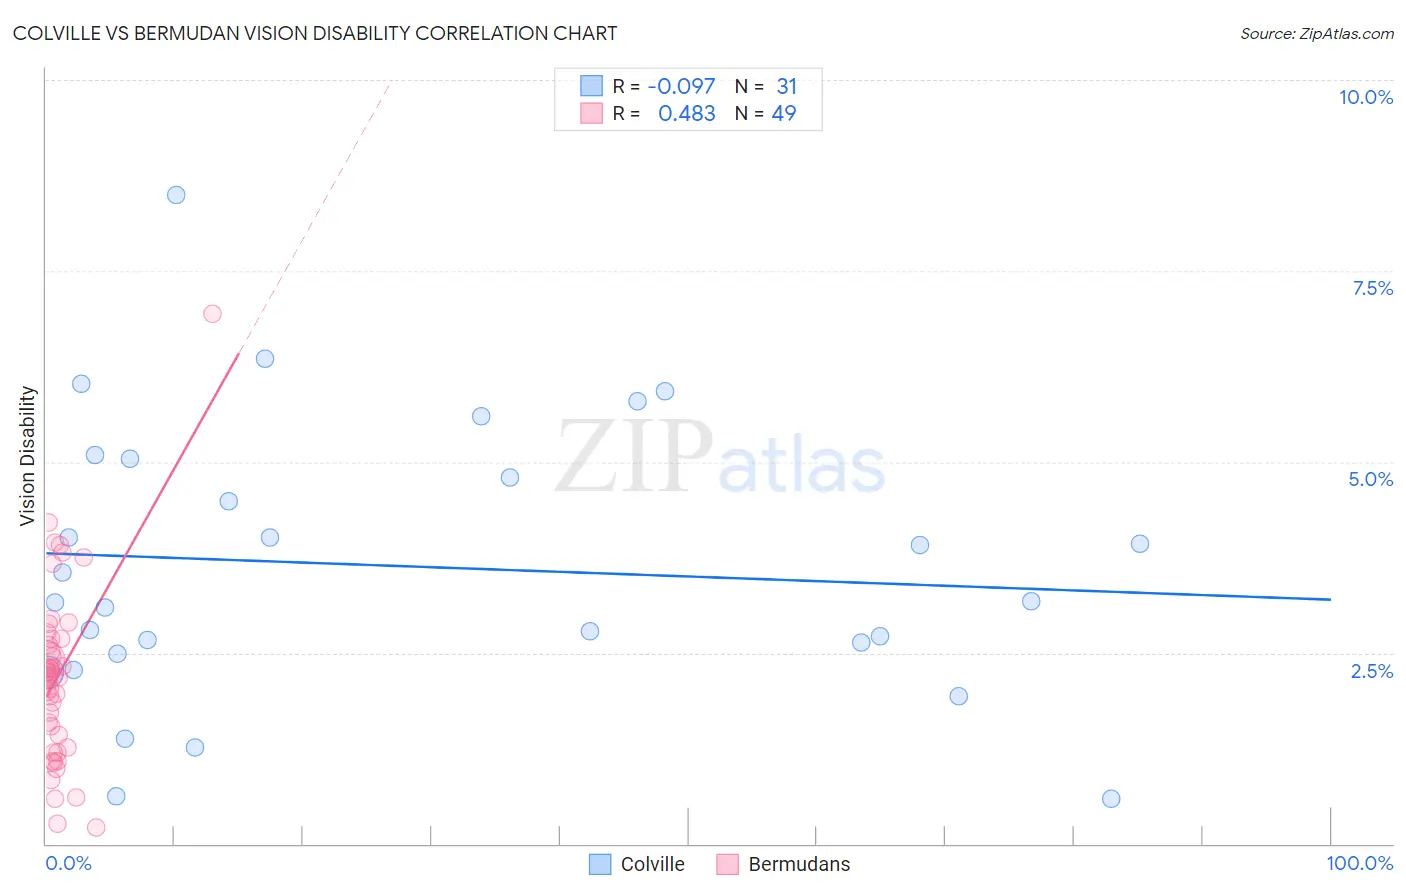
Colville vs Bermudan Vision Disability Correlation Chart
The statistical analysis conducted on geographies consisting of 34,683,927 people shows a slight negative correlation between the proportion of Colville and percentage of population with vision disability in the United States with a correlation coefficient (R) of -0.097 and weighted average of 3.0%. Similarly, the statistical analysis conducted on geographies consisting of 55,718,331 people shows a moderate positive correlation between the proportion of Bermudans and percentage of population with vision disability in the United States with a correlation coefficient (R) of 0.483 and weighted average of 2.2%, a difference of 34.8%.
Vision Disability Correlation Summary
| Measurement | Colville | Bermudan |
| Minimum | 0.59% | 0.22% |
| Maximum | 8.5% | 6.9% |
| Range | 7.9% | 6.7% |
| Mean | 3.6% | 2.2% |
| Median | 3.2% | 2.2% |
| Interquartile 25% (IQ1) | 2.5% | 1.3% |
| Interquartile 75% (IQ3) | 5.0% | 2.7% |
| Interquartile Range (IQR) | 2.5% | 1.3% |
| Standard Deviation (Sample) | 1.8% | 1.2% |
| Standard Deviation (Population) | 1.8% | 1.2% |
Similar Demographics by Vision Disability
Demographics Similar to Colville by Vision Disability
In terms of vision disability, the demographic groups most similar to Colville are Central American Indian (3.0%, a difference of 0.64%), Seminole (3.1%, a difference of 1.1%), Cajun (3.1%, a difference of 1.1%), Apache (3.0%, a difference of 1.2%), and Yuman (3.0%, a difference of 1.4%).
| Demographics | Rating | Rank | Vision Disability |
| Tlingit-Haida | 0.0 /100 | #323 | Tragic 2.9% |
| Hopi | 0.0 /100 | #324 | Tragic 2.9% |
| Cherokee | 0.0 /100 | #325 | Tragic 2.9% |
| Spanish Americans | 0.0 /100 | #326 | Tragic 2.9% |
| Natives/Alaskans | 0.0 /100 | #327 | Tragic 3.0% |
| Yuman | 0.0 /100 | #328 | Tragic 3.0% |
| Apache | 0.0 /100 | #329 | Tragic 3.0% |
| Colville | 0.0 /100 | #330 | Tragic 3.0% |
| Central American Indians | 0.0 /100 | #331 | Tragic 3.0% |
| Seminole | 0.0 /100 | #332 | Tragic 3.1% |
| Cajuns | 0.0 /100 | #333 | Tragic 3.1% |
| Cheyenne | 0.0 /100 | #334 | Tragic 3.1% |
| Navajo | 0.0 /100 | #335 | Tragic 3.1% |
| Alaskan Athabascans | 0.0 /100 | #336 | Tragic 3.1% |
| Dutch West Indians | 0.0 /100 | #337 | Tragic 3.2% |
Demographics Similar to Bermudans by Vision Disability
In terms of vision disability, the demographic groups most similar to Bermudans are Immigrants from Ghana (2.2%, a difference of 0.010%), Indonesian (2.2%, a difference of 0.090%), Trinidadian and Tobagonian (2.2%, a difference of 0.14%), Nigerian (2.3%, a difference of 0.35%), and Immigrants from Uruguay (2.2%, a difference of 0.43%).
| Demographics | Rating | Rank | Vision Disability |
| Samoans | 15.7 /100 | #205 | Poor 2.2% |
| Pennsylvania Germans | 14.5 /100 | #206 | Poor 2.2% |
| Immigrants | Nigeria | 13.5 /100 | #207 | Poor 2.2% |
| Germans | 13.4 /100 | #208 | Poor 2.2% |
| Immigrants | Brazil | 13.1 /100 | #209 | Poor 2.2% |
| Immigrants | Uruguay | 11.5 /100 | #210 | Poor 2.2% |
| Indonesians | 9.5 /100 | #211 | Tragic 2.2% |
| Bermudans | 9.0 /100 | #212 | Tragic 2.2% |
| Immigrants | Ghana | 8.9 /100 | #213 | Tragic 2.2% |
| Trinidadians and Tobagonians | 8.2 /100 | #214 | Tragic 2.2% |
| Nigerians | 7.2 /100 | #215 | Tragic 2.3% |
| Immigrants | Trinidad and Tobago | 6.1 /100 | #216 | Tragic 2.3% |
| Barbadians | 5.1 /100 | #217 | Tragic 2.3% |
| Portuguese | 4.9 /100 | #218 | Tragic 2.3% |
| Ecuadorians | 4.6 /100 | #219 | Tragic 2.3% |