Slavic vs Kenyan Vision Disability
COMPARE
Slavic
Kenyan
Vision Disability
Vision Disability Comparison
Slavs
Kenyans
2.2%
VISION DISABILITY
46.0/ 100
METRIC RATING
177th/ 347
METRIC RANK
2.1%
VISION DISABILITY
92.5/ 100
METRIC RATING
113th/ 347
METRIC RANK
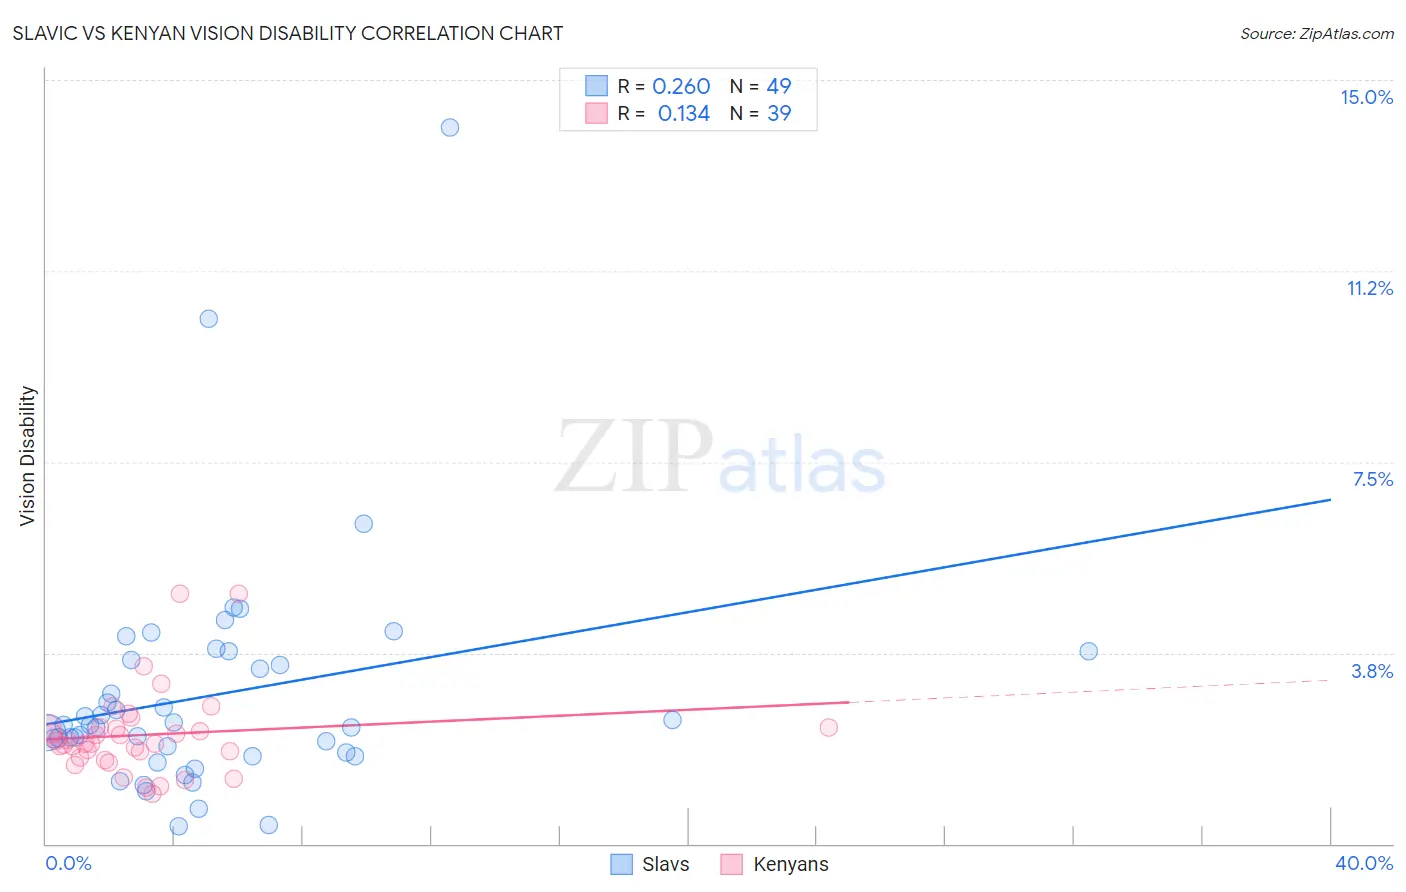
Slavic vs Kenyan Vision Disability Correlation Chart
The statistical analysis conducted on geographies consisting of 270,742,725 people shows a weak positive correlation between the proportion of Slavs and percentage of population with vision disability in the United States with a correlation coefficient (R) of 0.260 and weighted average of 2.2%. Similarly, the statistical analysis conducted on geographies consisting of 168,152,432 people shows a poor positive correlation between the proportion of Kenyans and percentage of population with vision disability in the United States with a correlation coefficient (R) of 0.134 and weighted average of 2.1%, a difference of 4.4%.
Vision Disability Correlation Summary
| Measurement | Slavic | Kenyan |
| Minimum | 0.34% | 0.99% |
| Maximum | 14.1% | 4.9% |
| Range | 13.7% | 3.9% |
| Mean | 2.9% | 2.1% |
| Median | 2.3% | 2.0% |
| Interquartile 25% (IQ1) | 1.8% | 1.7% |
| Interquartile 75% (IQ3) | 3.7% | 2.3% |
| Interquartile Range (IQR) | 1.9% | 0.58% |
| Standard Deviation (Sample) | 2.3% | 0.84% |
| Standard Deviation (Population) | 2.3% | 0.83% |
Similar Demographics by Vision Disability
Demographics Similar to Slavs by Vision Disability
In terms of vision disability, the demographic groups most similar to Slavs are Yugoslavian (2.2%, a difference of 0.040%), Immigrants from Oceania (2.2%, a difference of 0.050%), Immigrants from North America (2.2%, a difference of 0.090%), Immigrants from Fiji (2.2%, a difference of 0.11%), and Uruguayan (2.2%, a difference of 0.21%).
| Demographics | Rating | Rank | Vision Disability |
| Swiss | 55.7 /100 | #170 | Average 2.2% |
| Lebanese | 54.3 /100 | #171 | Average 2.2% |
| Northern Europeans | 50.1 /100 | #172 | Average 2.2% |
| Scandinavians | 50.0 /100 | #173 | Average 2.2% |
| Immigrants | Canada | 50.0 /100 | #174 | Average 2.2% |
| Immigrants | Fiji | 47.6 /100 | #175 | Average 2.2% |
| Yugoslavians | 46.5 /100 | #176 | Average 2.2% |
| Slavs | 46.0 /100 | #177 | Average 2.2% |
| Immigrants | Oceania | 45.1 /100 | #178 | Average 2.2% |
| Immigrants | North America | 44.5 /100 | #179 | Average 2.2% |
| Uruguayans | 42.7 /100 | #180 | Average 2.2% |
| Immigrants | Western Europe | 41.1 /100 | #181 | Average 2.2% |
| Costa Ricans | 40.7 /100 | #182 | Average 2.2% |
| Immigrants | Burma/Myanmar | 37.9 /100 | #183 | Fair 2.2% |
| Moroccans | 35.4 /100 | #184 | Fair 2.2% |
Demographics Similar to Kenyans by Vision Disability
In terms of vision disability, the demographic groups most similar to Kenyans are Croatian (2.1%, a difference of 0.030%), Immigrants from Vietnam (2.1%, a difference of 0.060%), Ugandan (2.1%, a difference of 0.060%), Polish (2.1%, a difference of 0.11%), and Immigrants from Denmark (2.1%, a difference of 0.12%).
| Demographics | Rating | Rank | Vision Disability |
| Swedes | 94.2 /100 | #106 | Exceptional 2.1% |
| Danes | 94.2 /100 | #107 | Exceptional 2.1% |
| Koreans | 94.1 /100 | #108 | Exceptional 2.1% |
| Chileans | 94.0 /100 | #109 | Exceptional 2.1% |
| Immigrants | Armenia | 93.8 /100 | #110 | Exceptional 2.1% |
| Peruvians | 93.5 /100 | #111 | Exceptional 2.1% |
| Immigrants | Denmark | 92.9 /100 | #112 | Exceptional 2.1% |
| Kenyans | 92.5 /100 | #113 | Exceptional 2.1% |
| Croatians | 92.3 /100 | #114 | Exceptional 2.1% |
| Immigrants | Vietnam | 92.2 /100 | #115 | Exceptional 2.1% |
| Ugandans | 92.2 /100 | #116 | Exceptional 2.1% |
| Poles | 92.0 /100 | #117 | Exceptional 2.1% |
| Immigrants | Philippines | 91.4 /100 | #118 | Exceptional 2.1% |
| Immigrants | Uganda | 91.4 /100 | #119 | Exceptional 2.1% |
| Immigrants | Zimbabwe | 91.0 /100 | #120 | Exceptional 2.1% |