Shoshone vs French American Indian Female Disability
COMPARE
Shoshone
French American Indian
Female Disability
Female Disability Comparison
Shoshone
French American Indians
13.2%
FEMALE DISABILITY
0.0/ 100
METRIC RATING
291st/ 347
METRIC RANK
13.7%
FEMALE DISABILITY
0.0/ 100
METRIC RATING
309th/ 347
METRIC RANK
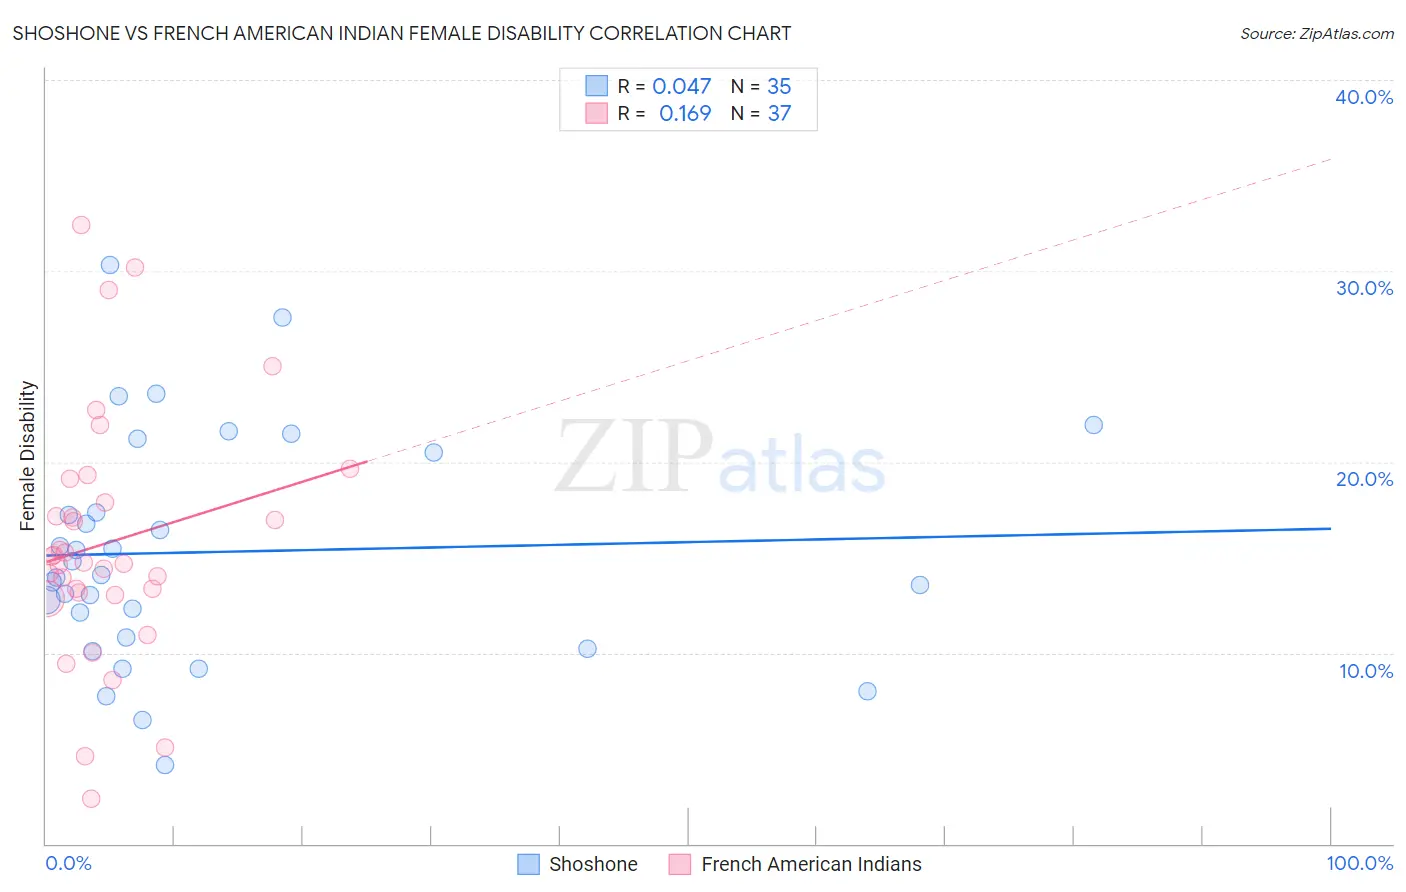
Shoshone vs French American Indian Female Disability Correlation Chart
The statistical analysis conducted on geographies consisting of 66,617,208 people shows no correlation between the proportion of Shoshone and percentage of females with a disability in the United States with a correlation coefficient (R) of 0.047 and weighted average of 13.2%. Similarly, the statistical analysis conducted on geographies consisting of 131,961,738 people shows a poor positive correlation between the proportion of French American Indians and percentage of females with a disability in the United States with a correlation coefficient (R) of 0.169 and weighted average of 13.7%, a difference of 3.6%.
Female Disability Correlation Summary
| Measurement | Shoshone | French American Indian |
| Minimum | 4.1% | 2.3% |
| Maximum | 30.3% | 32.4% |
| Range | 26.2% | 30.1% |
| Mean | 15.3% | 15.8% |
| Median | 14.1% | 14.8% |
| Interquartile 25% (IQ1) | 10.8% | 13.1% |
| Interquartile 75% (IQ3) | 20.5% | 18.5% |
| Interquartile Range (IQR) | 9.7% | 5.4% |
| Standard Deviation (Sample) | 6.0% | 6.5% |
| Standard Deviation (Population) | 5.9% | 6.4% |
Demographics Similar to Shoshone and French American Indians by Female Disability
In terms of female disability, the demographic groups most similar to Shoshone are Immigrants from Yemen (13.2%, a difference of 0.060%), Yakama (13.2%, a difference of 0.17%), Marshallese (13.3%, a difference of 0.43%), Celtic (13.3%, a difference of 0.47%), and French (13.3%, a difference of 0.68%). Similarly, the demographic groups most similar to French American Indians are Cree (13.7%, a difference of 0.060%), Apache (13.7%, a difference of 0.12%), Central American Indian (13.6%, a difference of 0.52%), French Canadian (13.6%, a difference of 0.81%), and Dominican (13.5%, a difference of 1.4%).
| Demographics | Rating | Rank | Female Disability |
| Immigrants | Yemen | 0.0 /100 | #290 | Tragic 13.2% |
| Shoshone | 0.0 /100 | #291 | Tragic 13.2% |
| Yakama | 0.0 /100 | #292 | Tragic 13.2% |
| Marshallese | 0.0 /100 | #293 | Tragic 13.3% |
| Celtics | 0.0 /100 | #294 | Tragic 13.3% |
| French | 0.0 /100 | #295 | Tragic 13.3% |
| Nepalese | 0.0 /100 | #296 | Tragic 13.3% |
| Slovaks | 0.0 /100 | #297 | Tragic 13.3% |
| Immigrants | Nonimmigrants | 0.0 /100 | #298 | Tragic 13.4% |
| Immigrants | Dominican Republic | 0.0 /100 | #299 | Tragic 13.4% |
| Pennsylvania Germans | 0.0 /100 | #300 | Tragic 13.4% |
| Africans | 0.0 /100 | #301 | Tragic 13.4% |
| Scotch-Irish | 0.0 /100 | #302 | Tragic 13.4% |
| Immigrants | Portugal | 0.0 /100 | #303 | Tragic 13.5% |
| Immigrants | Micronesia | 0.0 /100 | #304 | Tragic 13.5% |
| Dominicans | 0.0 /100 | #305 | Tragic 13.5% |
| French Canadians | 0.0 /100 | #306 | Tragic 13.6% |
| Central American Indians | 0.0 /100 | #307 | Tragic 13.6% |
| Cree | 0.0 /100 | #308 | Tragic 13.7% |
| French American Indians | 0.0 /100 | #309 | Tragic 13.7% |
| Apache | 0.0 /100 | #310 | Tragic 13.7% |