Immigrants from Germany vs French American Indian Female Disability
COMPARE
Immigrants from Germany
French American Indian
Female Disability
Female Disability Comparison
Immigrants from Germany
French American Indians
12.7%
FEMALE DISABILITY
1.3/ 100
METRIC RATING
255th/ 347
METRIC RANK
13.7%
FEMALE DISABILITY
0.0/ 100
METRIC RATING
309th/ 347
METRIC RANK
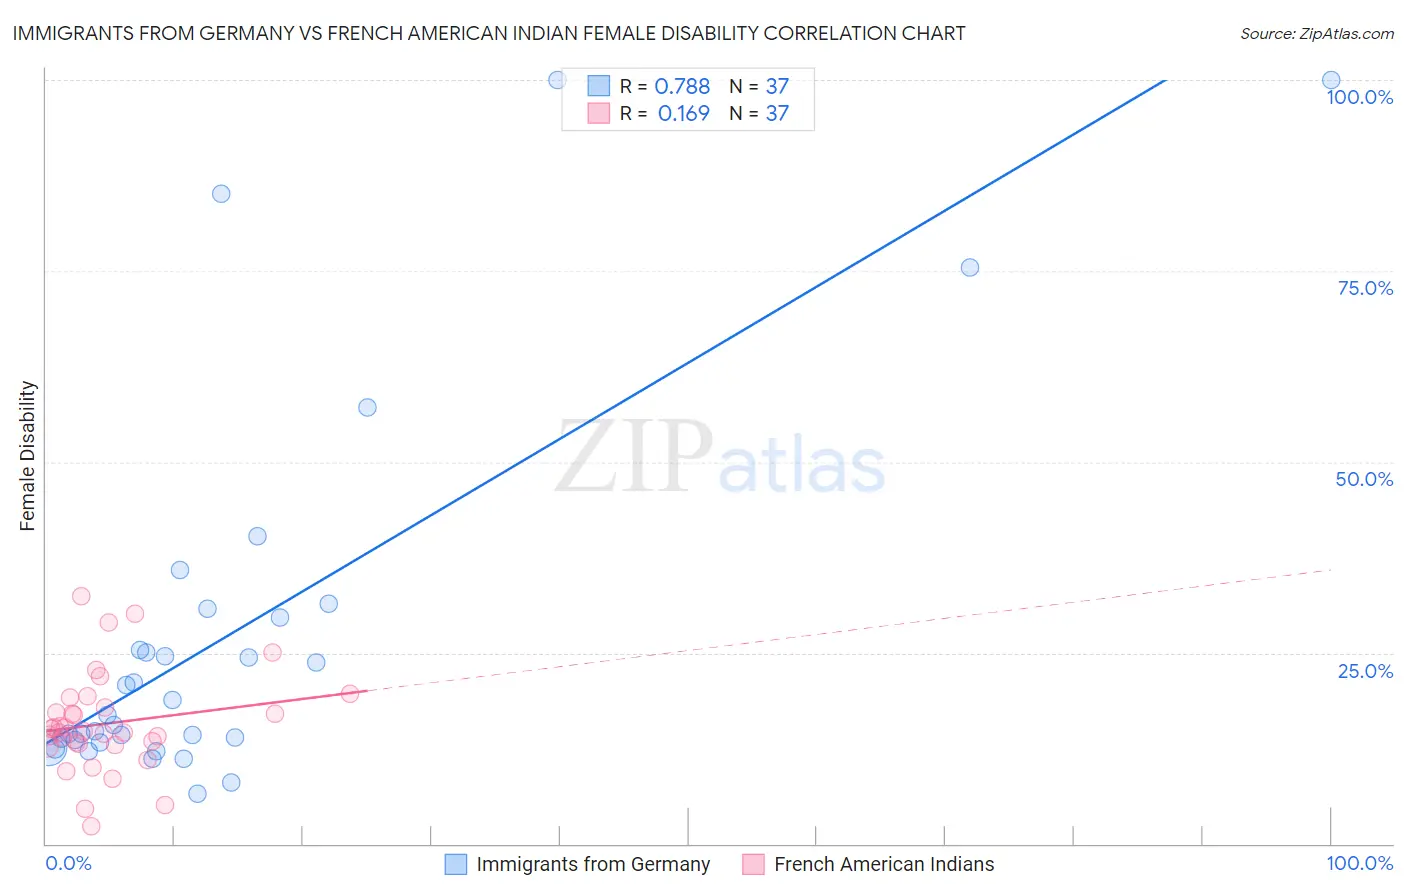
Immigrants from Germany vs French American Indian Female Disability Correlation Chart
The statistical analysis conducted on geographies consisting of 463,857,992 people shows a strong positive correlation between the proportion of Immigrants from Germany and percentage of females with a disability in the United States with a correlation coefficient (R) of 0.788 and weighted average of 12.7%. Similarly, the statistical analysis conducted on geographies consisting of 131,961,738 people shows a poor positive correlation between the proportion of French American Indians and percentage of females with a disability in the United States with a correlation coefficient (R) of 0.169 and weighted average of 13.7%, a difference of 7.8%.
Female Disability Correlation Summary
| Measurement | Immigrants from Germany | French American Indian |
| Minimum | 6.6% | 2.3% |
| Maximum | 100.0% | 32.4% |
| Range | 93.4% | 30.1% |
| Mean | 27.4% | 15.8% |
| Median | 16.9% | 14.8% |
| Interquartile 25% (IQ1) | 13.4% | 13.1% |
| Interquartile 75% (IQ3) | 30.2% | 18.5% |
| Interquartile Range (IQR) | 16.8% | 5.4% |
| Standard Deviation (Sample) | 24.5% | 6.5% |
| Standard Deviation (Population) | 24.2% | 6.4% |
Similar Demographics by Female Disability
Demographics Similar to Immigrants from Germany by Female Disability
In terms of female disability, the demographic groups most similar to Immigrants from Germany are British West Indian (12.7%, a difference of 0.070%), Hawaiian (12.7%, a difference of 0.080%), Liberian (12.7%, a difference of 0.10%), Aleut (12.7%, a difference of 0.10%), and Jamaican (12.7%, a difference of 0.11%).
| Demographics | Rating | Rank | Female Disability |
| Carpatho Rusyns | 2.0 /100 | #248 | Tragic 12.6% |
| Immigrants | Congo | 1.8 /100 | #249 | Tragic 12.7% |
| Slovenes | 1.7 /100 | #250 | Tragic 12.7% |
| Crow | 1.6 /100 | #251 | Tragic 12.7% |
| Immigrants | Caribbean | 1.4 /100 | #252 | Tragic 12.7% |
| Jamaicans | 1.4 /100 | #253 | Tragic 12.7% |
| Hawaiians | 1.4 /100 | #254 | Tragic 12.7% |
| Immigrants | Germany | 1.3 /100 | #255 | Tragic 12.7% |
| British West Indians | 1.2 /100 | #256 | Tragic 12.7% |
| Liberians | 1.1 /100 | #257 | Tragic 12.7% |
| Aleuts | 1.1 /100 | #258 | Tragic 12.7% |
| Immigrants | Armenia | 1.0 /100 | #259 | Tragic 12.7% |
| Sub-Saharan Africans | 1.0 /100 | #260 | Tragic 12.7% |
| Bermudans | 1.0 /100 | #261 | Tragic 12.7% |
| Czechoslovakians | 0.9 /100 | #262 | Tragic 12.7% |
Demographics Similar to French American Indians by Female Disability
In terms of female disability, the demographic groups most similar to French American Indians are Cree (13.7%, a difference of 0.060%), Apache (13.7%, a difference of 0.12%), Hopi (13.7%, a difference of 0.41%), Central American Indian (13.6%, a difference of 0.52%), and Delaware (13.8%, a difference of 0.72%).
| Demographics | Rating | Rank | Female Disability |
| Scotch-Irish | 0.0 /100 | #302 | Tragic 13.4% |
| Immigrants | Portugal | 0.0 /100 | #303 | Tragic 13.5% |
| Immigrants | Micronesia | 0.0 /100 | #304 | Tragic 13.5% |
| Dominicans | 0.0 /100 | #305 | Tragic 13.5% |
| French Canadians | 0.0 /100 | #306 | Tragic 13.6% |
| Central American Indians | 0.0 /100 | #307 | Tragic 13.6% |
| Cree | 0.0 /100 | #308 | Tragic 13.7% |
| French American Indians | 0.0 /100 | #309 | Tragic 13.7% |
| Apache | 0.0 /100 | #310 | Tragic 13.7% |
| Hopi | 0.0 /100 | #311 | Tragic 13.7% |
| Delaware | 0.0 /100 | #312 | Tragic 13.8% |
| Blackfeet | 0.0 /100 | #313 | Tragic 13.8% |
| Puget Sound Salish | 0.0 /100 | #314 | Tragic 13.8% |
| Alaskan Athabascans | 0.0 /100 | #315 | Tragic 13.9% |
| Spanish Americans | 0.0 /100 | #316 | Tragic 14.0% |