Colombian vs French American Indian Female Disability
COMPARE
Colombian
French American Indian
Female Disability
Female Disability Comparison
Colombians
French American Indians
11.5%
FEMALE DISABILITY
99.8/ 100
METRIC RATING
69th/ 347
METRIC RANK
13.7%
FEMALE DISABILITY
0.0/ 100
METRIC RATING
309th/ 347
METRIC RANK
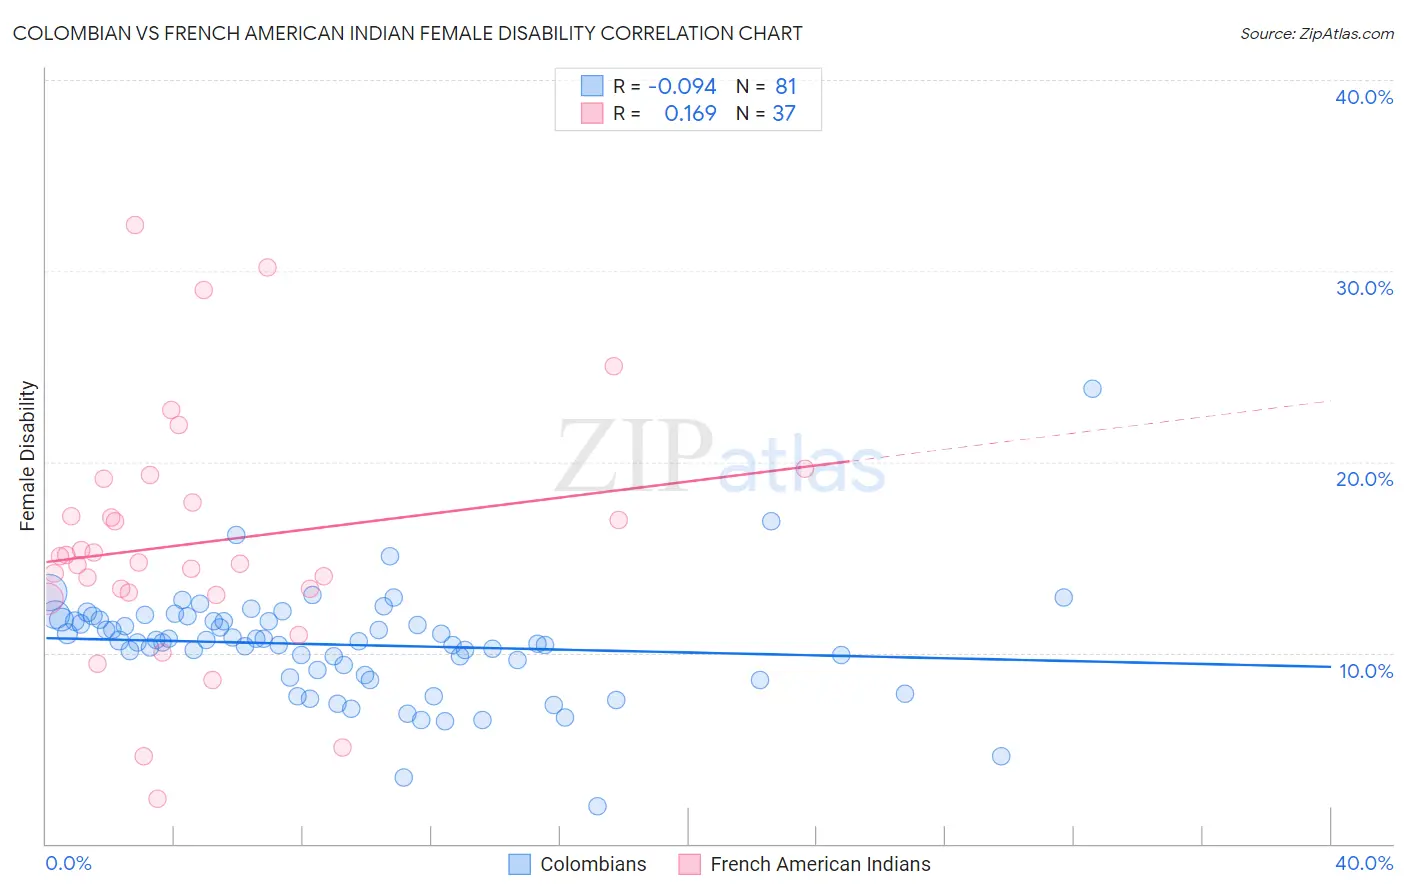
Colombian vs French American Indian Female Disability Correlation Chart
The statistical analysis conducted on geographies consisting of 419,587,687 people shows a slight negative correlation between the proportion of Colombians and percentage of females with a disability in the United States with a correlation coefficient (R) of -0.094 and weighted average of 11.5%. Similarly, the statistical analysis conducted on geographies consisting of 131,961,738 people shows a poor positive correlation between the proportion of French American Indians and percentage of females with a disability in the United States with a correlation coefficient (R) of 0.169 and weighted average of 13.7%, a difference of 19.3%.
Female Disability Correlation Summary
| Measurement | Colombian | French American Indian |
| Minimum | 1.9% | 2.3% |
| Maximum | 23.8% | 32.4% |
| Range | 21.9% | 30.1% |
| Mean | 10.4% | 15.8% |
| Median | 10.6% | 14.8% |
| Interquartile 25% (IQ1) | 9.0% | 13.1% |
| Interquartile 75% (IQ3) | 11.7% | 18.5% |
| Interquartile Range (IQR) | 2.7% | 5.4% |
| Standard Deviation (Sample) | 2.9% | 6.5% |
| Standard Deviation (Population) | 2.9% | 6.4% |
Similar Demographics by Female Disability
Demographics Similar to Colombians by Female Disability
In terms of female disability, the demographic groups most similar to Colombians are Immigrants from Chile (11.5%, a difference of 0.010%), Immigrants from Ireland (11.5%, a difference of 0.050%), Immigrants from Northern Africa (11.5%, a difference of 0.070%), Immigrants from Vietnam (11.5%, a difference of 0.090%), and Chilean (11.5%, a difference of 0.12%).
| Demographics | Rating | Rank | Female Disability |
| Sri Lankans | 99.9 /100 | #62 | Exceptional 11.4% |
| Immigrants | Colombia | 99.9 /100 | #63 | Exceptional 11.4% |
| Immigrants | El Salvador | 99.9 /100 | #64 | Exceptional 11.4% |
| Immigrants | South America | 99.9 /100 | #65 | Exceptional 11.4% |
| Salvadorans | 99.8 /100 | #66 | Exceptional 11.5% |
| Immigrants | Vietnam | 99.8 /100 | #67 | Exceptional 11.5% |
| Immigrants | Northern Africa | 99.8 /100 | #68 | Exceptional 11.5% |
| Colombians | 99.8 /100 | #69 | Exceptional 11.5% |
| Immigrants | Chile | 99.8 /100 | #70 | Exceptional 11.5% |
| Immigrants | Ireland | 99.8 /100 | #71 | Exceptional 11.5% |
| Chileans | 99.8 /100 | #72 | Exceptional 11.5% |
| Immigrants | Switzerland | 99.8 /100 | #73 | Exceptional 11.5% |
| Bhutanese | 99.8 /100 | #74 | Exceptional 11.5% |
| Immigrants | Lebanon | 99.7 /100 | #75 | Exceptional 11.5% |
| Immigrants | Eritrea | 99.7 /100 | #76 | Exceptional 11.5% |
Demographics Similar to French American Indians by Female Disability
In terms of female disability, the demographic groups most similar to French American Indians are Cree (13.7%, a difference of 0.060%), Apache (13.7%, a difference of 0.12%), Hopi (13.7%, a difference of 0.41%), Central American Indian (13.6%, a difference of 0.52%), and Delaware (13.8%, a difference of 0.72%).
| Demographics | Rating | Rank | Female Disability |
| Scotch-Irish | 0.0 /100 | #302 | Tragic 13.4% |
| Immigrants | Portugal | 0.0 /100 | #303 | Tragic 13.5% |
| Immigrants | Micronesia | 0.0 /100 | #304 | Tragic 13.5% |
| Dominicans | 0.0 /100 | #305 | Tragic 13.5% |
| French Canadians | 0.0 /100 | #306 | Tragic 13.6% |
| Central American Indians | 0.0 /100 | #307 | Tragic 13.6% |
| Cree | 0.0 /100 | #308 | Tragic 13.7% |
| French American Indians | 0.0 /100 | #309 | Tragic 13.7% |
| Apache | 0.0 /100 | #310 | Tragic 13.7% |
| Hopi | 0.0 /100 | #311 | Tragic 13.7% |
| Delaware | 0.0 /100 | #312 | Tragic 13.8% |
| Blackfeet | 0.0 /100 | #313 | Tragic 13.8% |
| Puget Sound Salish | 0.0 /100 | #314 | Tragic 13.8% |
| Alaskan Athabascans | 0.0 /100 | #315 | Tragic 13.9% |
| Spanish Americans | 0.0 /100 | #316 | Tragic 14.0% |