Shoshone vs Hopi Female Disability
COMPARE
Shoshone
Hopi
Female Disability
Female Disability Comparison
Shoshone
Hopi
13.2%
FEMALE DISABILITY
0.0/ 100
METRIC RATING
291st/ 347
METRIC RANK
13.7%
FEMALE DISABILITY
0.0/ 100
METRIC RATING
311th/ 347
METRIC RANK
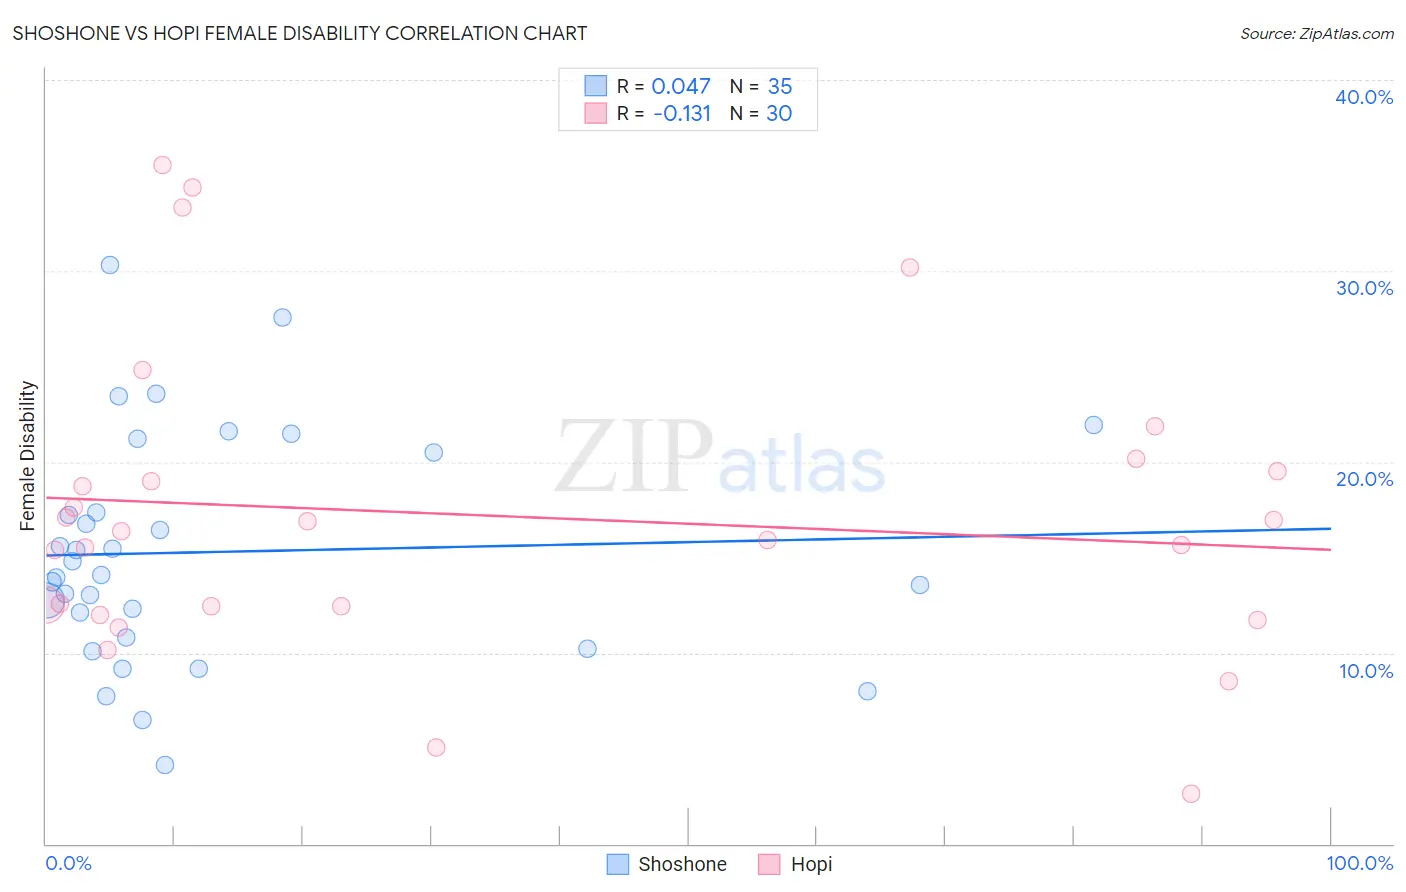
Shoshone vs Hopi Female Disability Correlation Chart
The statistical analysis conducted on geographies consisting of 66,617,208 people shows no correlation between the proportion of Shoshone and percentage of females with a disability in the United States with a correlation coefficient (R) of 0.047 and weighted average of 13.2%. Similarly, the statistical analysis conducted on geographies consisting of 74,733,138 people shows a poor negative correlation between the proportion of Hopi and percentage of females with a disability in the United States with a correlation coefficient (R) of -0.131 and weighted average of 13.7%, a difference of 4.0%.
Female Disability Correlation Summary
| Measurement | Shoshone | Hopi |
| Minimum | 4.1% | 2.6% |
| Maximum | 30.3% | 35.6% |
| Range | 26.2% | 33.0% |
| Mean | 15.3% | 17.2% |
| Median | 14.1% | 16.2% |
| Interquartile 25% (IQ1) | 10.8% | 12.4% |
| Interquartile 75% (IQ3) | 20.5% | 19.5% |
| Interquartile Range (IQR) | 9.7% | 7.1% |
| Standard Deviation (Sample) | 6.0% | 8.0% |
| Standard Deviation (Population) | 5.9% | 7.8% |
Demographics Similar to Shoshone and Hopi by Female Disability
In terms of female disability, the demographic groups most similar to Shoshone are Yakama (13.2%, a difference of 0.17%), Marshallese (13.3%, a difference of 0.43%), Celtic (13.3%, a difference of 0.47%), French (13.3%, a difference of 0.68%), and Nepalese (13.3%, a difference of 0.82%). Similarly, the demographic groups most similar to Hopi are Apache (13.7%, a difference of 0.29%), French American Indian (13.7%, a difference of 0.41%), Cree (13.7%, a difference of 0.46%), Central American Indian (13.6%, a difference of 0.92%), and French Canadian (13.6%, a difference of 1.2%).
| Demographics | Rating | Rank | Female Disability |
| Shoshone | 0.0 /100 | #291 | Tragic 13.2% |
| Yakama | 0.0 /100 | #292 | Tragic 13.2% |
| Marshallese | 0.0 /100 | #293 | Tragic 13.3% |
| Celtics | 0.0 /100 | #294 | Tragic 13.3% |
| French | 0.0 /100 | #295 | Tragic 13.3% |
| Nepalese | 0.0 /100 | #296 | Tragic 13.3% |
| Slovaks | 0.0 /100 | #297 | Tragic 13.3% |
| Immigrants | Nonimmigrants | 0.0 /100 | #298 | Tragic 13.4% |
| Immigrants | Dominican Republic | 0.0 /100 | #299 | Tragic 13.4% |
| Pennsylvania Germans | 0.0 /100 | #300 | Tragic 13.4% |
| Africans | 0.0 /100 | #301 | Tragic 13.4% |
| Scotch-Irish | 0.0 /100 | #302 | Tragic 13.4% |
| Immigrants | Portugal | 0.0 /100 | #303 | Tragic 13.5% |
| Immigrants | Micronesia | 0.0 /100 | #304 | Tragic 13.5% |
| Dominicans | 0.0 /100 | #305 | Tragic 13.5% |
| French Canadians | 0.0 /100 | #306 | Tragic 13.6% |
| Central American Indians | 0.0 /100 | #307 | Tragic 13.6% |
| Cree | 0.0 /100 | #308 | Tragic 13.7% |
| French American Indians | 0.0 /100 | #309 | Tragic 13.7% |
| Apache | 0.0 /100 | #310 | Tragic 13.7% |
| Hopi | 0.0 /100 | #311 | Tragic 13.7% |