Shoshone vs Uruguayan Female Disability
COMPARE
Shoshone
Uruguayan
Female Disability
Female Disability Comparison
Shoshone
Uruguayans
13.2%
FEMALE DISABILITY
0.0/ 100
METRIC RATING
291st/ 347
METRIC RANK
11.7%
FEMALE DISABILITY
98.8/ 100
METRIC RATING
98th/ 347
METRIC RANK
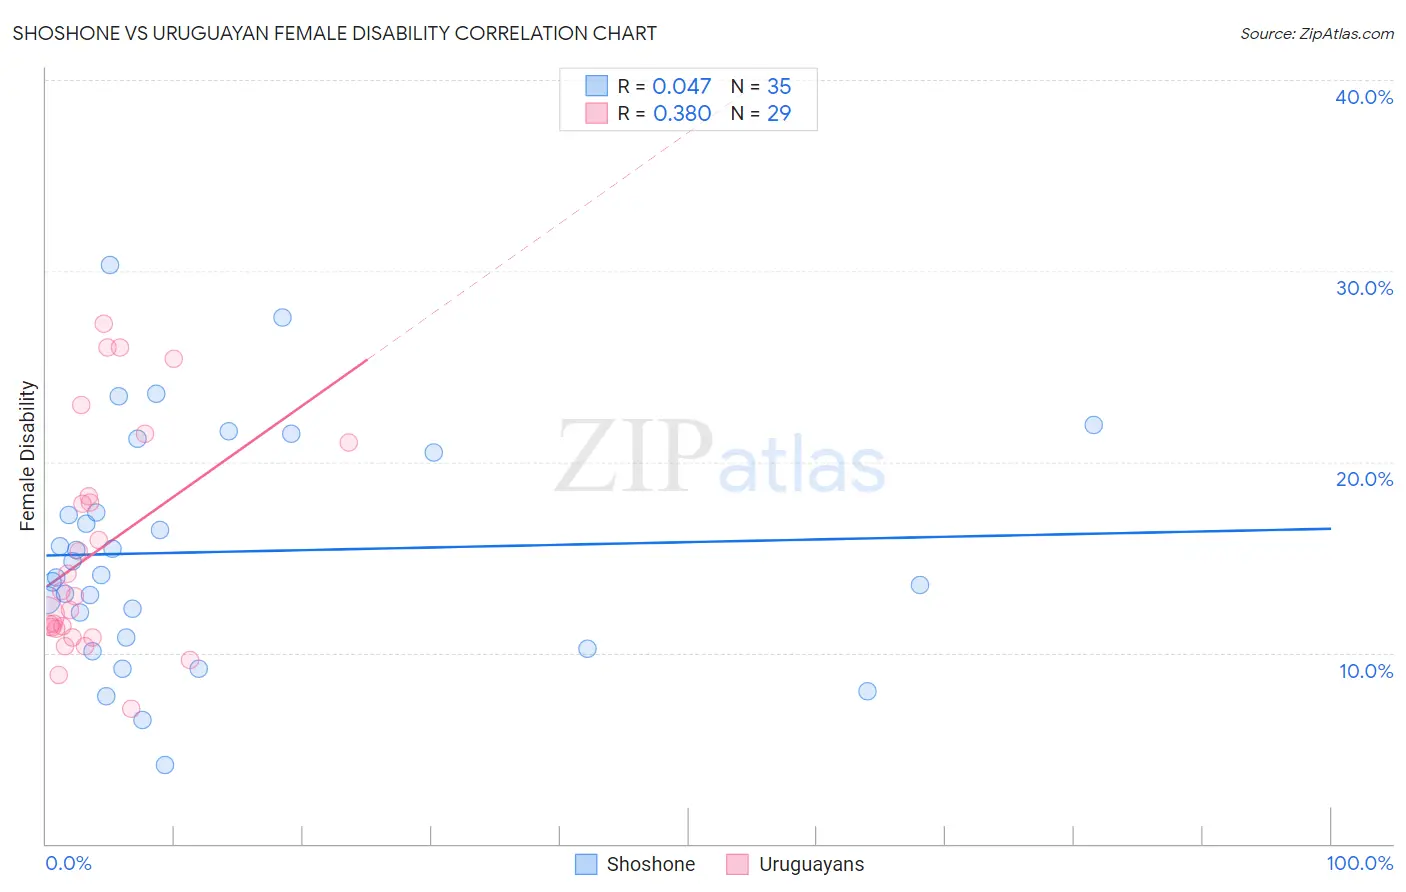
Shoshone vs Uruguayan Female Disability Correlation Chart
The statistical analysis conducted on geographies consisting of 66,617,208 people shows no correlation between the proportion of Shoshone and percentage of females with a disability in the United States with a correlation coefficient (R) of 0.047 and weighted average of 13.2%. Similarly, the statistical analysis conducted on geographies consisting of 144,784,627 people shows a mild positive correlation between the proportion of Uruguayans and percentage of females with a disability in the United States with a correlation coefficient (R) of 0.380 and weighted average of 11.7%, a difference of 13.1%.
Female Disability Correlation Summary
| Measurement | Shoshone | Uruguayan |
| Minimum | 4.1% | 7.1% |
| Maximum | 30.3% | 27.2% |
| Range | 26.2% | 20.2% |
| Mean | 15.3% | 15.3% |
| Median | 14.1% | 12.9% |
| Interquartile 25% (IQ1) | 10.8% | 11.0% |
| Interquartile 75% (IQ3) | 20.5% | 19.6% |
| Interquartile Range (IQR) | 9.7% | 8.6% |
| Standard Deviation (Sample) | 6.0% | 5.9% |
| Standard Deviation (Population) | 5.9% | 5.8% |
Similar Demographics by Female Disability
Demographics Similar to Shoshone by Female Disability
In terms of female disability, the demographic groups most similar to Shoshone are Tlingit-Haida (13.2%, a difference of 0.060%), Immigrants from Yemen (13.2%, a difference of 0.060%), Yakama (13.2%, a difference of 0.17%), White/Caucasian (13.2%, a difference of 0.24%), and Yaqui (13.2%, a difference of 0.34%).
| Demographics | Rating | Rank | Female Disability |
| Hmong | 0.0 /100 | #284 | Tragic 13.1% |
| Bangladeshis | 0.0 /100 | #285 | Tragic 13.1% |
| Fijians | 0.0 /100 | #286 | Tragic 13.1% |
| Yaqui | 0.0 /100 | #287 | Tragic 13.2% |
| Whites/Caucasians | 0.0 /100 | #288 | Tragic 13.2% |
| Tlingit-Haida | 0.0 /100 | #289 | Tragic 13.2% |
| Immigrants | Yemen | 0.0 /100 | #290 | Tragic 13.2% |
| Shoshone | 0.0 /100 | #291 | Tragic 13.2% |
| Yakama | 0.0 /100 | #292 | Tragic 13.2% |
| Marshallese | 0.0 /100 | #293 | Tragic 13.3% |
| Celtics | 0.0 /100 | #294 | Tragic 13.3% |
| French | 0.0 /100 | #295 | Tragic 13.3% |
| Nepalese | 0.0 /100 | #296 | Tragic 13.3% |
| Slovaks | 0.0 /100 | #297 | Tragic 13.3% |
| Immigrants | Nonimmigrants | 0.0 /100 | #298 | Tragic 13.4% |
Demographics Similar to Uruguayans by Female Disability
In terms of female disability, the demographic groups most similar to Uruguayans are Korean (11.7%, a difference of 0.14%), Immigrants from Russia (11.7%, a difference of 0.15%), Immigrants from Philippines (11.7%, a difference of 0.21%), Immigrants from Uruguay (11.7%, a difference of 0.26%), and Immigrants from Costa Rica (11.7%, a difference of 0.28%).
| Demographics | Rating | Rank | Female Disability |
| Immigrants | Zimbabwe | 99.5 /100 | #91 | Exceptional 11.6% |
| Immigrants | Czechoslovakia | 99.5 /100 | #92 | Exceptional 11.6% |
| Immigrants | Sierra Leone | 99.4 /100 | #93 | Exceptional 11.6% |
| Immigrants | Brazil | 99.4 /100 | #94 | Exceptional 11.6% |
| Immigrants | Northern Europe | 99.4 /100 | #95 | Exceptional 11.6% |
| Immigrants | Russia | 99.0 /100 | #96 | Exceptional 11.7% |
| Koreans | 99.0 /100 | #97 | Exceptional 11.7% |
| Uruguayans | 98.8 /100 | #98 | Exceptional 11.7% |
| Immigrants | Philippines | 98.6 /100 | #99 | Exceptional 11.7% |
| Immigrants | Uruguay | 98.5 /100 | #100 | Exceptional 11.7% |
| Immigrants | Costa Rica | 98.4 /100 | #101 | Exceptional 11.7% |
| Immigrants | South Eastern Asia | 98.4 /100 | #102 | Exceptional 11.7% |
| Immigrants | Eastern Africa | 98.3 /100 | #103 | Exceptional 11.7% |
| Immigrants | Western Asia | 98.3 /100 | #104 | Exceptional 11.7% |
| Australians | 98.3 /100 | #105 | Exceptional 11.7% |